By projecting price action dynamics, moving averages, and technical metrics within a dedicated independent panel, this tool obviates the necessity for manual toggling between chart periodicities. This streamlined approach significantly enhances workflow efficiency for multi-timeframe analysis.
https://cdn.tradingfinder.com/file/5...4-by-tflab.zip
https://www.cryptocraft.com/thread/1...-mt5-freetflab
https://www.forexfactory.com/thread/...-in-metatrader
Prop Firm DrawDown Protector : Prop Firm Capital Protection Expert MT4 | Forex Money Management: Forex Trade Management Expert MT4 |ICT Concepts Indicator MT4 | Smart Money Concepts Expert MT4| Smart Money Trap Scanner | Get a free Expert Advisor license via Telegram and WhatsApp
Multi Timeframe Multi Chart Indicator Specifications
The following list outlines the technical characteristics, compatibility, and functional features of the Multi Timeframe Multi Chart indicator:
- Indicator Categories: Trading Assist MT4 Indicators, Moving Average MT4 Indicators.
- Platform Compatibility: MetaTrader 4 (MT4).
- Required Skill Level: Intermediate.
- Indicator Classification: Reversal Indicators, Non-Repainting Indicators.
- Timeframe Capability: Multi-Timeframe functionality.
- Trading Styles: Day Trading, Scalping, Swing Trading.
- Tradable Instruments: Share Stocks, Indices Market, Commodity Market, Stock Market, Cryptocurrency, and Forex pairs.
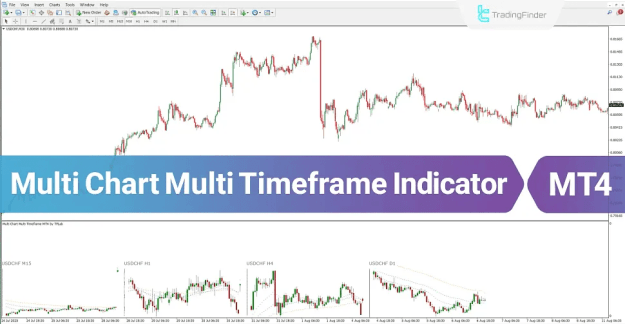
Multi Timeframe Multi Chart Indicator at a Glance
The primary utility of the Multi Chart Multi Timeframe indicator lies in the comparative analysis of bullish and bearish market phases.
The tool operates on the principle of confluence: when short-term and long-term timeframes exhibit alignment, it signals a high-probability trend. Conversely, divergence or conflicting signals between periodicities serve as a precursor to potential trend reversals or the onset of neutral, corrective market phases.
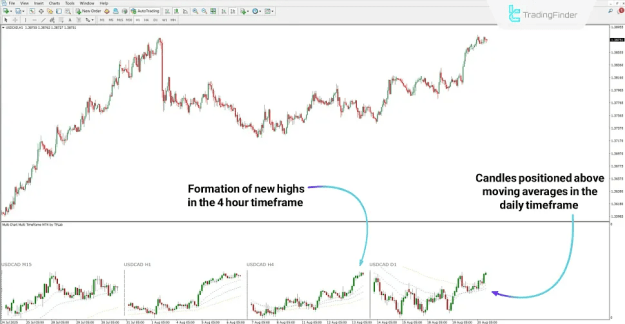
Bullish Trend Detection
An examination of the USD/CAD chart reveals a scenario where price action sustains a position above the moving averages across all monitored timeframes. This alignment confirms the continuation of an uptrend, characterized by the formation of consecutive higher highs and higher lows.
- Bullish Trend Analysis: Utilizing the Multi Timeframe Multi Chart Indicator to confirm upward momentum.
- Trend Change Identification: Locating shifts in market sentiment across timeframes.
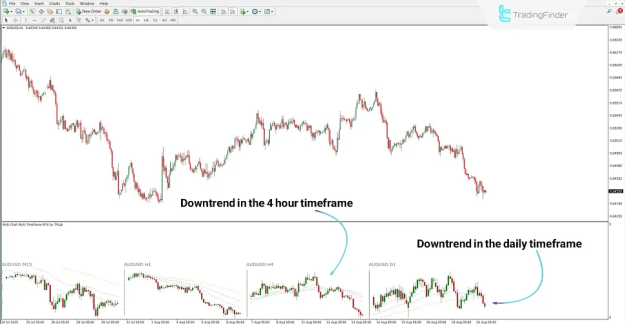
Bearish Trend Detection
Conversely, analysis of the AUD/USD chart demonstrates a bearish context where price action on both Daily and 4-Hour timeframes remains suppressed below the moving average. This structure indicates sustained selling pressure.
- Bearish Trend Analysis: Utilizing the Multi Chart Multi Timeframe Indicator to assess downward momentum.
- Price Drop Detection: Identifying potential short entries via multi-timeframe confirmation.
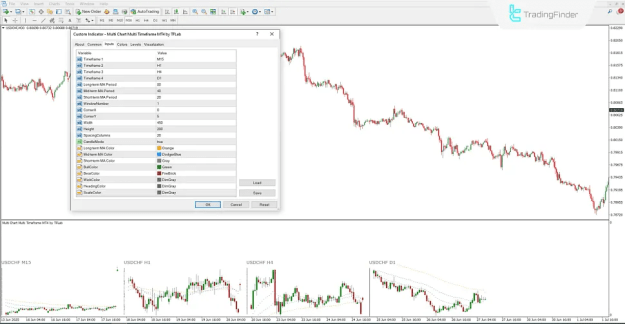
Multi Chart Multi Timeframe Indicator Settings
To customize the analytical panel, the Multi Chart Multi Timeframe indicator offers the following adjustable parameters:
- Timeframe Selection (1-4): Inputs to select the specific timeframes to be displayed in the panel.
- MA Period Settings: Configuration for Long-term, Mid-term, and Short-term moving average periods.
- Window & Position: Options for WindowNumber, CornerX, and CornerY to control the panel's location.
- Dimensions: Settings for Width, Height, and SpacingColumns to adjust the visual layout.
- CandleMode: Configuration for the visual representation of candlesticks.
- Color Customization (MA): Color settings for Long-term, Mid-term, and Short-term moving average lines.
- Color Customization (Candles): Color definitions for Bullish candles, Bearish candles, and Wicks.
- Interface Colors: Settings for HeadingColor and ScaleColor.
- System Requirement Note: For the correct visualization of this tool, the specific font included within the indicator's installation file must be installed on the user's operating system.
Conclusion
The Multi Chart Multi Timeframe indicator provides a panoramic view of market dynamics, permitting the simultaneous observation of multiple chart intervals.
Through this trading tool, investors can correlate the overarching macro trend visible in higher timeframes with the granular price action details of lower timeframes. Furthermore, the integration of short, medium, and long-term moving averages significantly enhances the precision of trend strength assessment and directional bias.