Crypto trade against the crowd with Long/Short Ratio Accounts
This system uses the 'Long/Short Ratio Accounts' indicator in Tradingview to trade against the general public (retail traders mostly) from Binance perpetual swap futures.
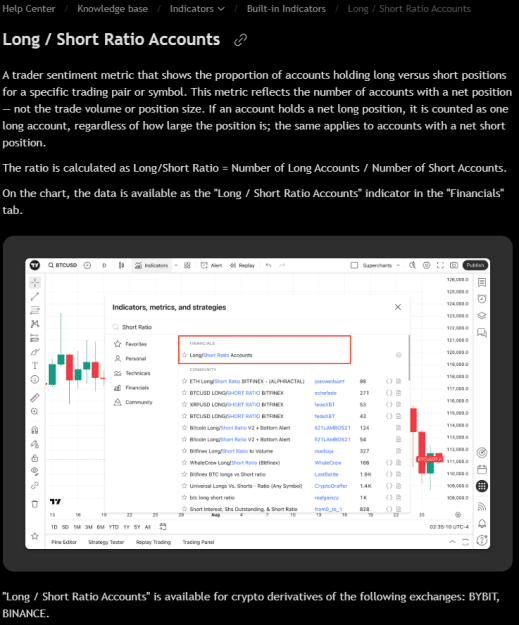
The Long/Short Ratio Accounts indicator shows the ratio between accounts that are long or short. That means a ratio of 1,00 is 50/50 where a ratio of 5,00 means there are five times more buy accounts while 0,33 means three times more selling accounts etc.
The theory behind is that most accounts lose money and by trading opposite of them all to gain an edge for a good yield return.
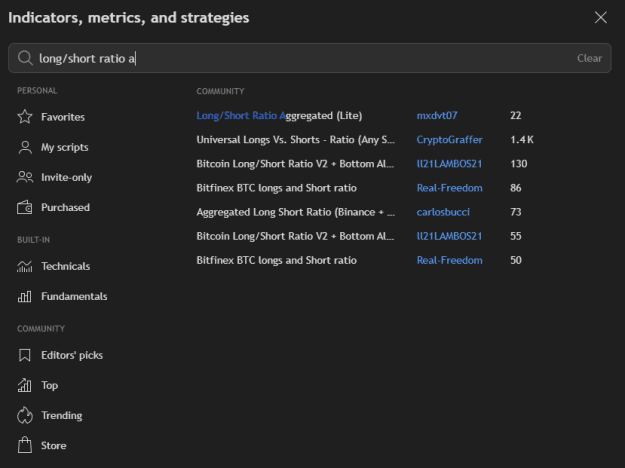
It's pretty simple, install the indicator from 'Indicators' (Long/Short Ratio Accounts) and combine it with price chart and then 'Inverse' the indicator.
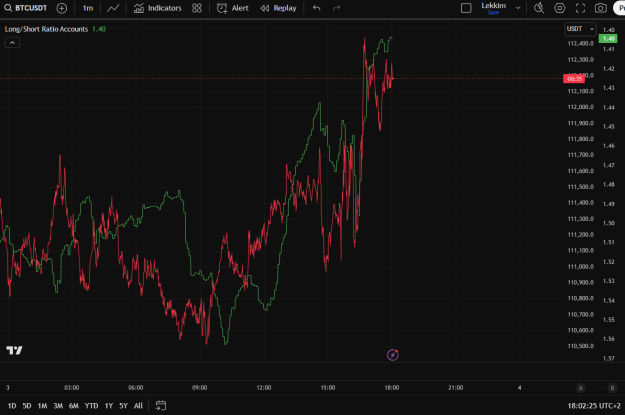
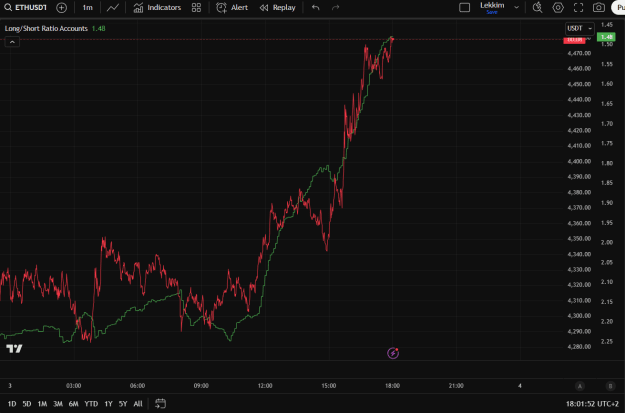
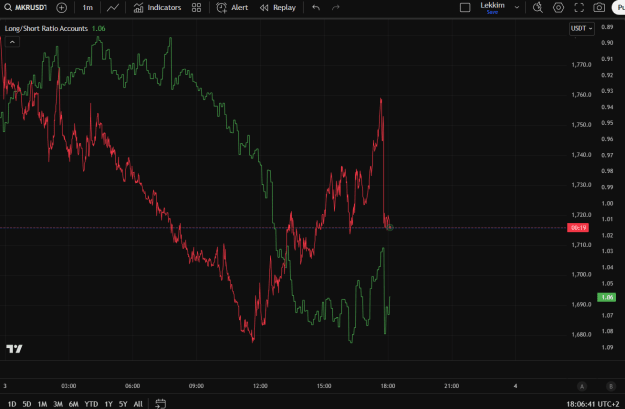
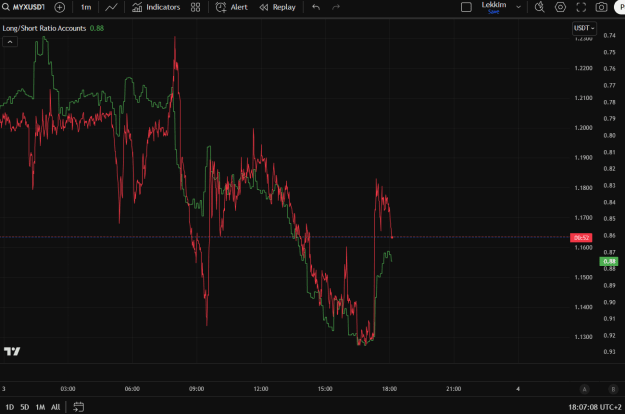
Then the two lines often and should follow each other, enter when there is a big gap between them and use of whatever timeframe you like (I prefer lower timeframes) So we look for both price and long ratio to rise to enter or both price to fall and short ratio to fall, meaning other traders are buying on a pump or selling more on a dump. Look for biggest gaps and differences and preferably that price makes it against the ratio instead of other way around. Usually the two lines follow each other, so when they don't trading opportunities are red price to follow green ratio.
Attached are pictures of some pairs (BTC, ETH, MKR and MYX) today on one minute with potential entries and later today I will make a voiced video on how to setup and what to look for more in detail. Looking forward to hear your opinion on this theory and system!
Price = Red
Long/Short Ratio Accounts = Green
This system uses the 'Long/Short Ratio Accounts' indicator in Tradingview to trade against the general public (retail traders mostly) from Binance perpetual swap futures.
The Long/Short Ratio Accounts indicator shows the ratio between accounts that are long or short. That means a ratio of 1,00 is 50/50 where a ratio of 5,00 means there are five times more buy accounts while 0,33 means three times more selling accounts etc.
The theory behind is that most accounts lose money and by trading opposite of them all to gain an edge for a good yield return.
It's pretty simple, install the indicator from 'Indicators' (Long/Short Ratio Accounts) and combine it with price chart and then 'Inverse' the indicator.
Then the two lines often and should follow each other, enter when there is a big gap between them and use of whatever timeframe you like (I prefer lower timeframes) So we look for both price and long ratio to rise to enter or both price to fall and short ratio to fall, meaning other traders are buying on a pump or selling more on a dump. Look for biggest gaps and differences and preferably that price makes it against the ratio instead of other way around. Usually the two lines follow each other, so when they don't trading opportunities are red price to follow green ratio.
Attached are pictures of some pairs (BTC, ETH, MKR and MYX) today on one minute with potential entries and later today I will make a voiced video on how to setup and what to look for more in detail. Looking forward to hear your opinion on this theory and system!
Price = Red
Long/Short Ratio Accounts = Green
Attached Image(s) (click to enlarge)