You can access the Indicator from this link:
https://tradingfinder.com/products/i...rterly-theory/
You can access the Indicator on the TradingView website:
https://www.tradingview.com/script/q...1-Q4-Sessions/
Prop Firm DrawDown Protector : Prop Firm Capital Protection Expert MT5 |Forex Money Management: Forex Trade Management Expert MT5 | ICT Concepts Indicator MT5 |Smart Money Concepts Expert MT5 | Smart Money Trap Scanner | Get a free Expert Advisor license via Telegram and WhatsApp
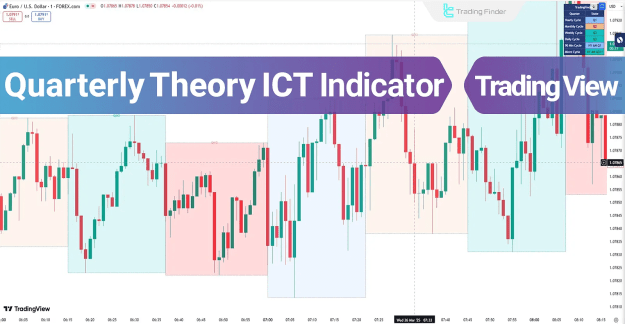
Indicator Overview and Key Features
This indicator provides a structured framework for understanding market movements and is applicable across multiple timeframes.
Indicator Specifications:
- Categories: The Quarterly Theory Indicator is categorized under ICT Tradingview Indicators, Session & KillZone Tradingview Indicators, and Cycles Tradingview Indicators.
- Platform: It is designed for use on the TradingView platform.
- Trading Skills: This tool is intended for traders with advanced skills due to its conceptual complexity.
- Indicator Types: It functions as a Reversal and Breakout indicator.
- Timeframe: It is a Multi-Timeframe indicator, applicable from yearly to micro cycles.
- Trading Style: It is highly effective for Day Trading.
- Instruments: The indicator can be used on various instruments, including Forex, Cryptocurrency, Stocks, and Futures.
The Four Trading Phases
The Quarterly Theory system breaks down market behavior into four cyclical phases, providing traders with a predictable model for market analysis:
- Q1 [Accumulation Phase]: The market consolidates, gathering liquidity in preparation for a new trend.
- Q2 [Manipulation Phase]: Characterized by sudden price swings and false breakouts designed to mislead traders before the true trend begins.
- Q3 [Distribution Phase]: A period of significant price movement, often marked by high volatility, as large positions are distributed.
- Q4 [Continuation/Reversal Phase]: The market either continues the existing trend or reverses into a new direction.
Practical Application in Trading
The indicator helps traders identify these cyclical patterns on their charts to anticipate market reversals and trend continuations.
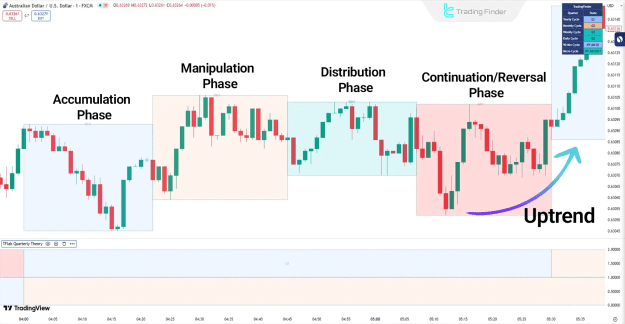
Analyzing an Uptrend
On an AUD/USD chart, the price might initially enter the Accumulation Phase (Q1), where liquidity is collected. In the Manipulation Phase (Q2), a false breakout to a higher high may occur, trapping traders in incorrect positions. The market then moves into the Distribution Phase (Q3), causing the price to decline. Finally, in the fourth phase (Q4), the true trend reverses, and the price begins its main bullish movement.
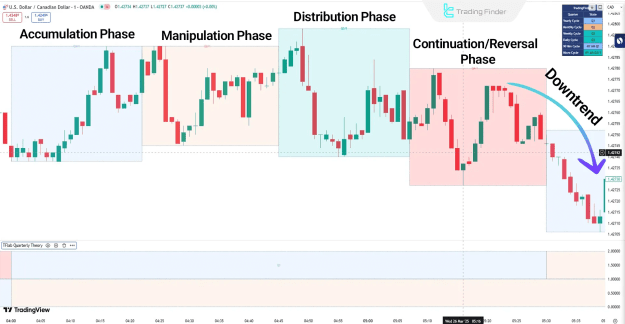
Analyzing a Downtrend
In a USD/CAD chart, the price may first move upward in the Accumulation Phase (Q1). A deceptive price drop may then occur in the Manipulation Phase (Q2). During the Distribution Phase (Q3), the price may create a new high to trigger stop losses. Ultimately, in the fourth phase (Q4), the market resumes its primary downtrend and continues its decline.
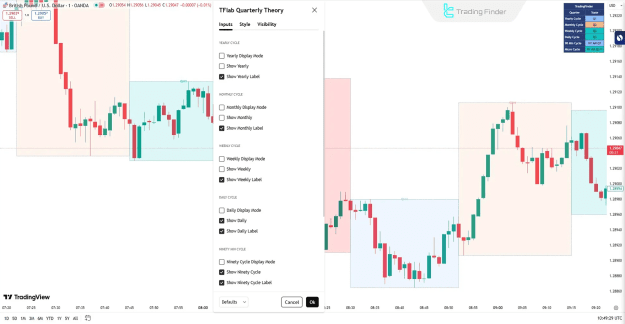
Customizing Indicator Settings
The Quarterly Theory ICT Indicator offers extensive customization across various time cycles, enabling traders to tailor it to their specific needs.
- Yearly Cycle: Allows for the visualization of yearly data and labels.
- Monthly Cycle: Enables the display of monthly data and labels.
- Weekly Cycle: Provides the option to visualize weekly data and labels.
- Daily Cycle: Offers the display of daily data and labels.
- Ninety-Minute Cycle: Provides visualization for 90-minute trading sessions.
- Micro Cycle: Allows for the display of micro-cycle data.
- Table Settings: Enables a table view with additional information for a more detailed analysis.
Conclusion
The Quarterly Theory Trading Indicator is a powerful framework for developing trading strategies based on ICT principles. By leveraging concepts like True Open, Accumulation, Manipulation, Distribution, and Continuation/Reversal, the indicator provides a clear, structured method for predicting market movements. Its multi-timeframe functionality, from yearly to micro cycles, makes it a versatile and indispensable tool for advanced traders.