You can access the Indicator from this link:
https://tradingfinder.com/products/i...soup-strategy/
You can access the Indicator on the TradingView website:
https://www.tradingview.com/script/L...FVG-CHoCH-CSD/
Prop Firm DrawDown Protector : Prop Firm Capital Protection Expert MT4 | Forex Money Management: Forex Trade Management Expert MT4 |ICT Concepts Indicator MT4 | Smart Money Concepts Expert MT4| Smart Money Trap Scanner | Get a free Expert Advisor license via Telegram and WhatsApp
Key Features of the Turtle Soup Strategy Indicator
- Detects false breakout patterns that indicate liquidity hunting.
- Highlights critical liquidity zones, such as major highs, lows, and key support/resistance levels.
- Implements concepts derived from Smart Money Concepts (SMC) and ICT methodologies.
- Supports multi-timeframe analysis for more precise trading.
- Suitable for various asset classes, including Forex, cryptocurrencies, stocks, and commodities.
- Designed for advanced traders using reversal and day trading strategies.
Indicator Functionality and Market Behavior
The Turtle Soup Strategy works on the principle that price movement through liquidity zones triggers stop-loss orders, which often leads to a rapid price reversal. This reversal is typically confirmed by one of the following key structures:
- Market Structure Shift (MSS)
- Change of Character (CHoCH)
- Change in State of Delivery (CSD)
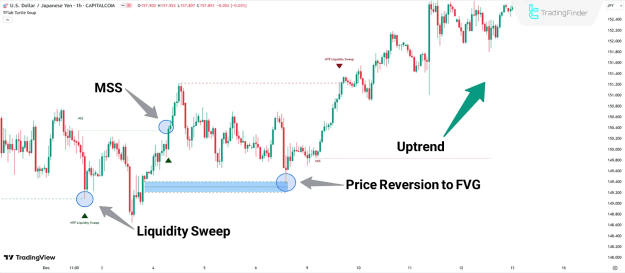
Uptrend Scenario
In an uptrend, as illustrated on the 1-hour USD/JPY chart:
- A Market Structure Shift (MSS) occurs following liquidity hunting.
- After the structural break, the price quickly reverses and targets the nearest Fair Value Gap (FVG) aligned with the prevailing trend, facilitating upward momentum.
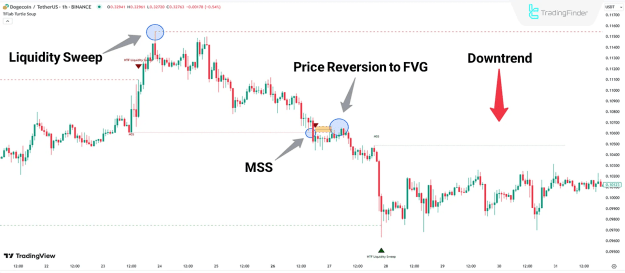
Downtrend Scenario
In a downtrend, as demonstrated on the 1-hour Dogecoin (DOGE) chart:
- Price triggers stop-loss orders at the recent high.
- After a Market Structure Shift (MSS), the price retraces to an FVG zone and continues its bearish movement.
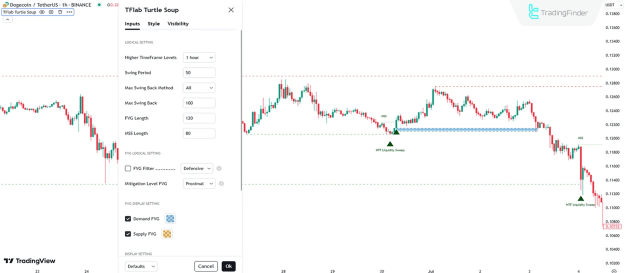
Customizable Indicator Settings
The Turtle Soup Strategy Indicator offers a variety of parameters that allow traders to adapt it to their trading preferences:
Logical Settings
- Selection of higher timeframe levels for liquidity identification.
- Default swing period for detecting market swings: 50.
- Maximum swing back method enabled for trend swing confirmation.
- Maximum swing back length: 100.
- FVG length: 120 bars.
- MSS length: 80 bars.
FVG Logical Settings
- Filters to select specific FVG types.
- Adjustment of mitigation levels for FVG zones.
FVG Display Settings
- Enable display of demand and supply Fair Value Gaps.
Display Options
- Show all higher timeframe liquidity levels.
- Display names for high and low liquidity levels on higher timeframes.
- Display all Market Structure Shifts (MSS) with labels for high and low MSS points.
Conclusion
The Turtle Soup Strategy Indicator integrates advanced market concepts such as Market Structure Shift (MSS), Change of Character (CHoCH), and Change in State of Delivery (CSD) to provide a reliable framework for detecting false breakouts and executing trades based on liquidity hunting.
This TradingView ICT indicator is particularly suitable for traders implementing liquidity-based strategies, including ICT and Smart Money Trading (SMT), enhancing their ability to capitalize on market inefficiencies.