By analyzing bullish and bearish order blocks, the indicator highlights key market reactions, allowing traders to capitalize on institutional-level price movements. Whether you trade forex, cryptocurrencies, or indices, this tool enhances decision-making by detecting liquidity sweeps and order block formations.
You can access the Indicator from this link:
https://tradingfinder.com/products/i...oney-setup-07/
You can access the Indicator on the TradingView website:
https://www.tradingview.com/script/N...unts-Minor-OB/
Prop Firm DrawDown Protector : Prop Firm Capital Protection Expert MT5 |Forex Money Management: Forex Trade Management Expert MT5 | ICT Concepts Indicator MT5 |Smart Money Concepts Expert MT5 | Smart Money Trap Scanner | Get a free Expert Advisor license via Telegram and WhatsApp
Understanding Smart Money Concepts
Smart money refers to the capital controlled by institutional traders, banks, and market makers. These entities influence price movements by entering high-liquidity zones, creating order blocks where significant reactions occur.
The Smart Money Setup 07 Indicator applies algorithmic analysis to:
- Detect bullish and bearish order blocks
- Identify liquidity pools
- Provide entry and exit signals via colored arrows
- Enhance trading strategies with multi-timeframe analysis
Bullish Order Blocks: Key Features
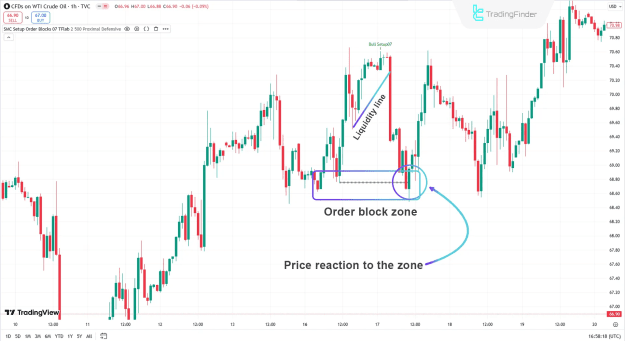
In an uptrend, the market forms higher highs (HH) and higher lows (HL). The indicator marks these zones with green rectangles, signaling strong support areas for potential buy trades.
Example: WTI Crude Oil (1-Hour Chart)
- After an upward move, price retraces into a liquidity zone.
- The indicator identifies the bullish order block, marked in green.
- Price reacts strongly, resuming the uptrend with momentum.
Key Signals:
![]() Green rectangles = Bullish order blocks
Green rectangles = Bullish order blocks
![]() Green arrows = High-probability buy signals
Green arrows = High-probability buy signals
Bearish Order Blocks: Strategic Trading Zones
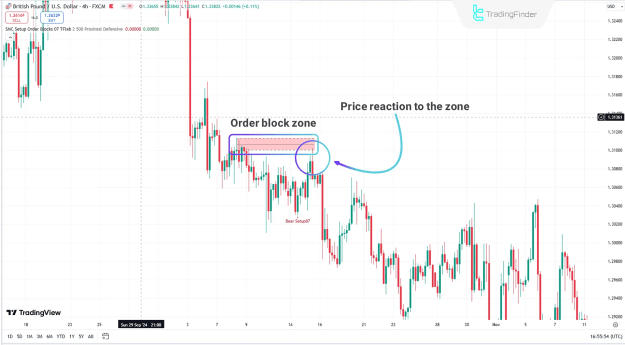
In a downtrend, the market forms lower highs (LH) and lower lows (LL). The indicator highlights these zones in red, indicating resistance areas for sell opportunities.
Example: GBP/USD (4-Hour Chart)
- Price corrects upward into a bearish order block.
- The indicator marks the zone in red, signaling selling pressure.
- Price rejects the zone, continuing the downtrend sharply.
Key Signals:
![]() Red rectangles = Bearish order blocks
Red rectangles = Bearish order blocks
![]() Red arrows = High-probability sell signals
Red arrows = High-probability sell signals
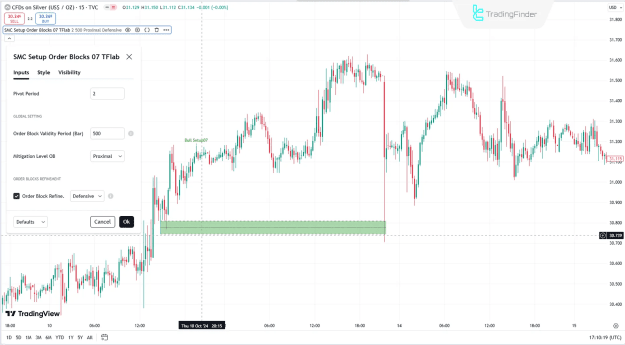
Indicator Settings & Customization
The Smart Money Setup 07 Indicator offers adjustable parameters for optimal performance:
1. Pivot Period
- Defines the number of candles needed to form a pivot (default: 2).
- Lower values detect pivots faster.
2. Order Block Validity Period
- Sets how long an order block remains active.
3. Mitigation Level OB
- Adjusts risk management by defining order block invalidation levels.
4. Order Block Refinement Modes
- Defensive Mode: Filters for safer, high-probability blocks.
- Aggressive Mode: Captures riskier but higher-reward reversals.
Conclusion
This TradingView indicator is essential for traders who follow smart money concepts. It provides:
![]() Accurate order block detection
Accurate order block detection
![]() Liquidity zone analysis
Liquidity zone analysis
![]() Multi-timeframe compatibility (scalping, day trading, swing trading)
Multi-timeframe compatibility (scalping, day trading, swing trading)
![]() Clear visual signals (arrows & rectangles)
Clear visual signals (arrows & rectangles)
By integrating this tool, traders can align with institutional strategies, minimize risks, and maximize profitability in forex, crypto, and indices.