TP & SL Tool: Risk Reward Ratio Calculator RRR MT4 | Prop Firm Protector: Trade Assist Prop Firm Plus TF Expert MT4 | Money Management + DrawDown Protector: Trade Panel Prop Firm Drawdawn Limiter Pro MT4 |Get a free Expert Advisor license via Telegram and WhatsApp
What Is RTM Style Trading?
RTM Style, short for "Read The Market," is an advanced trading methodology that focuses on analyzing price behavior through market structure, liquidity, and order flow dynamics. Unlike traditional technical analysis, which relies on indicators, RTM trading emphasizes understanding how large market participants influence price movements.
The core principle of RTM is to identify key zones where institutional traders enter or exit positions, rather than predicting future price movements. This approach helps traders align their strategies with real market behavior, improving trade accuracy and risk management.
Key Components of RTM Style Trading
- Market Structure Analysis – Identifying trends, reversals, and breakpoints.
- Supply & Demand Zones – Locating areas where price imbalances occur.
- Liquidity Concepts – Understanding stop hunts, compressions, and order flow.
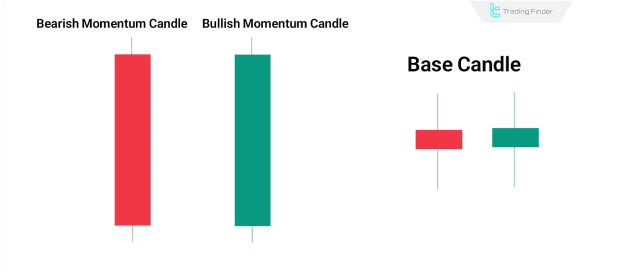
- Candle Analysis – Differentiating between momentum and base candles.
Core Concepts of RTM Style Trading
1. Market Structure in RTM
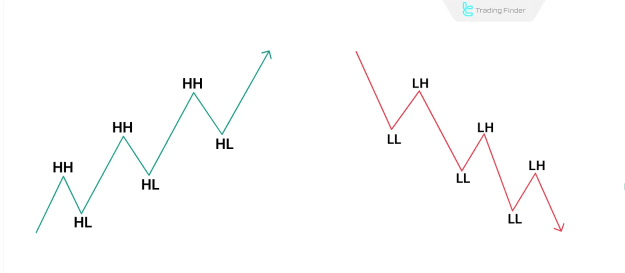
Market structure defines the trend by analyzing highs and lows:
- Higher Highs (HH) & Higher Lows (HL) = Bullish trend.
- Lower Highs (LH) & Lower Lows (LL) = Bearish trend.
A Structure Break occurs when price surpasses a key high or low, confirming trend continuation. Conversely, a Trend Reversal happens when price breaks a critical level against the prevailing trend.
2. Supply & Demand Zones in RTM
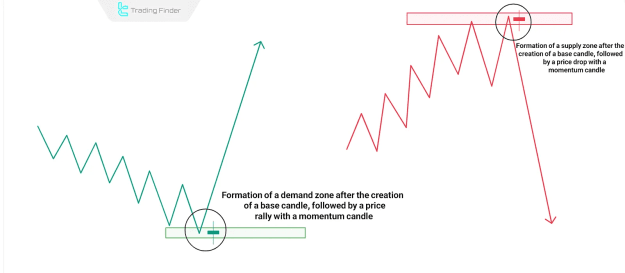
These zones represent areas where significant buying or selling pressure has previously occurred:
- Demand Zone – A price level where buyers dominate, leading to upward movements.
- Supply Zone – A price level where sellers take control, causing downward movements.
How to Draw Accurate Zones in RTM
- Zones are formed between the last base candle (balance) and the first momentum candle (imbalance).
- The stronger the price departure from the zone, the more valid it is.
3. Liquidity in RTM Trading
Liquidity is a driving force behind price movements. Key liquidity concepts include:
- Stop-Loss Clusters – Areas where retail traders place stops, attracting institutional players.
- Stop Hunts – Temporary price movements designed to trigger stops before reversing.
The Four Market Structures in RTM Style
RTM identifies four fundamental price structures that define market behavior:
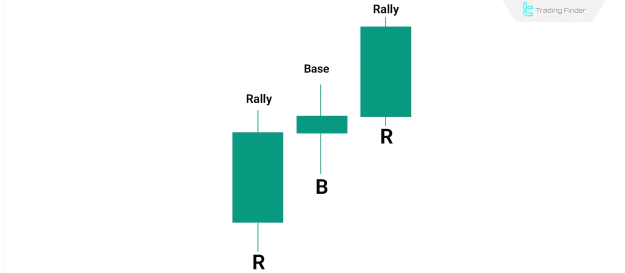
1. Rally–Base–Rally (RBR)
- Price rallies, consolidates (base), then continues upward.
- Indicates strong buyer momentum.
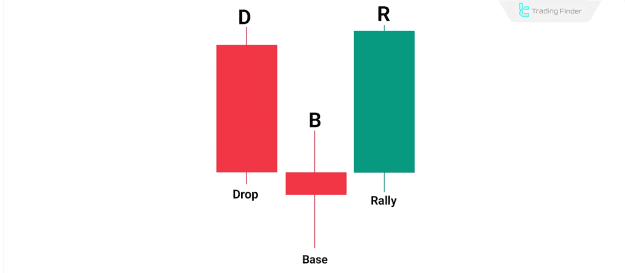
2. Drop–Base–Rally (DBR)
- Price declines, stabilizes (base), then reverses upward.
- Signals a shift from selling to buying pressure.
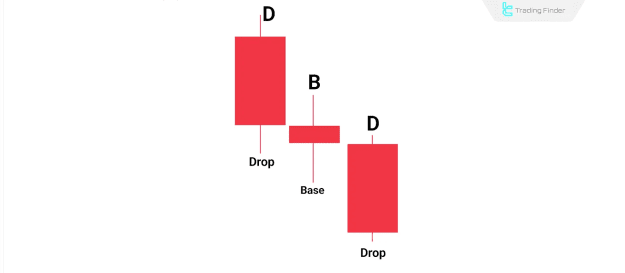
3. Drop–Base–Drop (DBD)
- Price drops, pauses (base), then continues downward.
- Confirms strong bearish continuation.
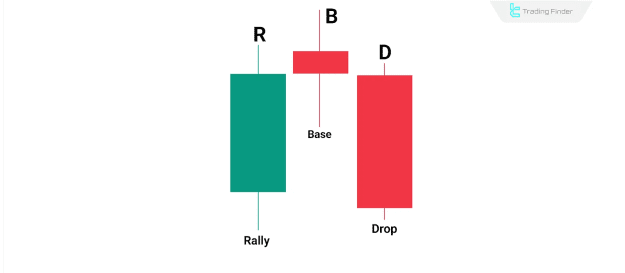
4. Rally–Base–Drop (RBD)
- Price rises, consolidates (base), then reverses downward.
- Indicates buyer exhaustion and new selling pressure.
Types of Zones in RTM Style
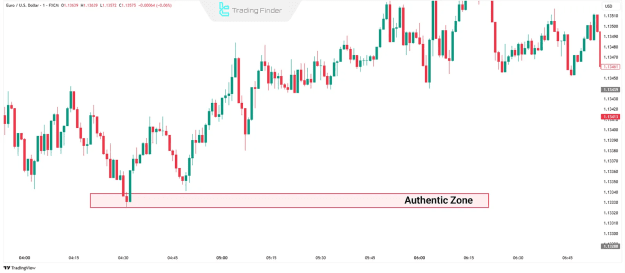
1. Authentic Zone
- The first strong imbalance zone with no prior overlapping reactions.
- Highest validity due to fresh institutional interest.
2. Reaction Zone
- A previously tested zone where price reacts again.
- Less reliable than Authentic Zones but still tradable with confirmation.
3. Fresh Zone
- A newly formed zone that price has not yet retested.
- The First Time Back (FTB) to a Fresh Zone often leads to strong reversals.
Key RTM Trading Setups and Patterns
1. Engulfing Pattern
- A bullish or bearish candle fully engulfs the previous candle.
- Signals a strong shift in market sentiment.
2. FL (Fail to Return) Setup
- Price breaks a key support/resistance level and does not retest it.
- Indicates strong continuation in the breakout direction.
3. FTR (Fail to Return) Pattern
- Price breaks a structure, retraces, but fails to reach the original level.
- Suggests trend continuation with high probability.
4. Caps Pattern
- A reversal setup where price makes a false breakout before reversing.
- Often traps retail traders before a sharp move in the opposite direction.
5. Swap Setup
- A strong supply/demand zone reverses its role after a powerful breakout.
- Former resistance becomes support (or vice versa).
6. 3Drive Pattern
- Three consecutive waves with weakening momentum before a reversal.
- Indicates trend exhaustion near key zones.
7. Compression (CP) Setup
- Repeated tests of a zone drain liquidity, leading to a sharp reversal.
- Often precedes strong breakout moves.
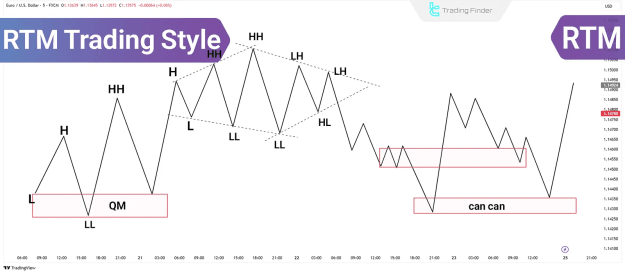
8. Quasimodo (QM) Pattern
- A reversal structure where price breaks key levels in succession.
- Bearish QM: Breaks a Higher Low (HL) after making a Higher High (HH).
- Bullish QM: Breaks a Lower High (LH) after making a Lower Low (LL).
9. Can Can Setup
- Combines Caps and Compression (CP) for a powerful reversal.
- Requires multiple confirmations for high-probability entries.
10. Diamond Pattern
- A complex reversal structure where price engulfs key levels before reversing.
- Often traps traders before a strong trend shift.
Conclusion
RTM Style provides a structured approach to analyzing price action by focusing on market structure, liquidity, and institutional order flow. By mastering key concepts like supply/demand zones, candle analysis, and reversal patterns, traders can improve their decision-making and trade execution.
Successful RTM trading requires:
- Patience – Waiting for high-probability setups.
- Discipline – Following strict risk management rules.
- Continuous Learning – Refining strategies based on real market behavior.
For traders looking to move beyond traditional indicators, RTM offers a powerful framework for understanding and profiting from real market dynamics.