Disliked{quote} What exactly is the plotted output of this indicator? Have you tried to draw what you’re describing on the chart? Even if it’s supposed to not draw anything and just show arrows on the chart, your explanations still have no clear starting point. Comparing the range of two candles is very simple and straightforward, but then what should we do next? For example, what happens when our value is 1? Does the slope of the moving average increase or decrease? And after our value is 1 or less than 1, what happens next? This part is unclear and it’s...Ignored
That is,
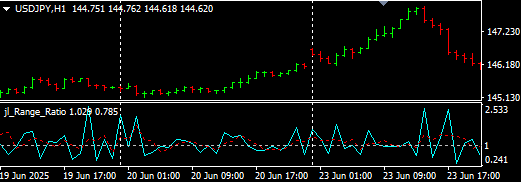
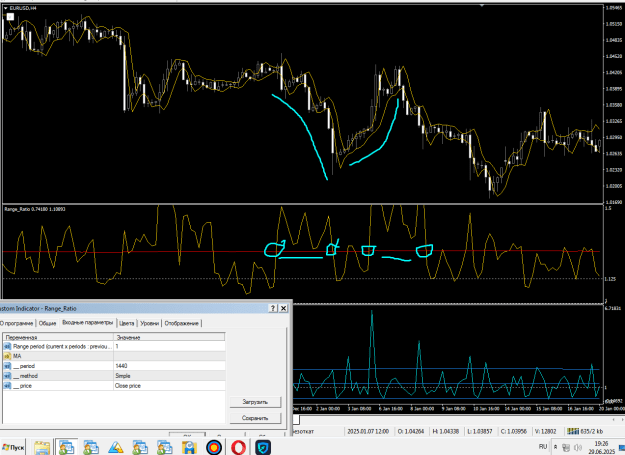
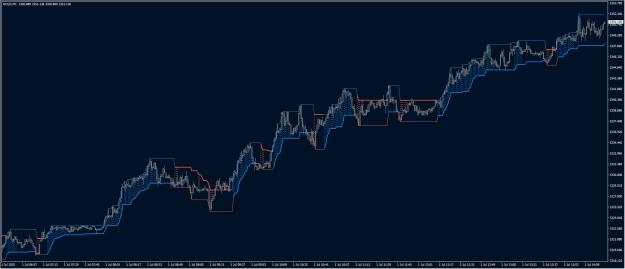
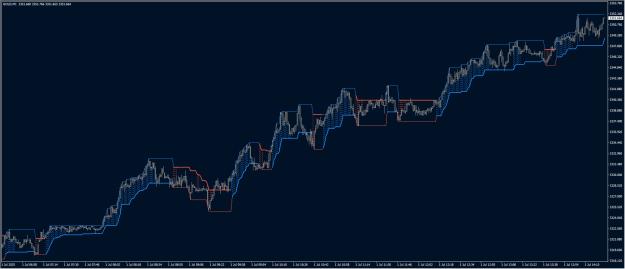
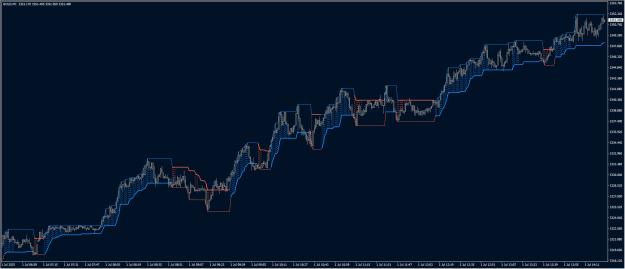
The level of level 1 is key and shows changes in volatility in the current moment. Signal MA smooths out data and you can choose a period for analysis