TP & SL Tool: Risk Reward Ratio Calculator RRR MT5 | Prop Firm Protector: Trade Assist Prop Firm Plus TF Expert MT5 | Money Management + DrawDown Protector: Trade Panel Prop Firm Drawdawn Limiter Pro MT5 |Get a free Expert Advisor license via Telegram and WhatsApp
The Concept of SIBI and BISI in ICT Methodology
These formations represent structural inefficiencies within the price, offering a glimpse into the underlying market dynamics. They indicate moments where one side of the market (buy or sell) significantly outweighs the other, leaving behind a gap that acts as a technical imbalance and a potential zone of interest for future trades.
What Is Buy-Side Imbalance and Sell-Side Inefficiency (BISI)?
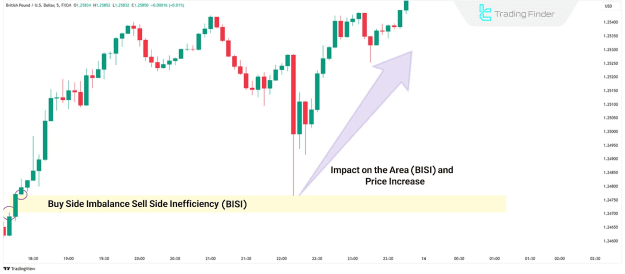
Buy-Side Imbalance and Sell-Side Inefficiency (BISI) highlights a bullish market gap created by strong buying momentum. This pattern reflects the dominance of buying pressure and a decline in selling interest.
Structure of BISI
- The first candle shows a strong bullish body, initiating upward pressure.
- The second candle continues the bullish move with a similarly strong body.
- The third candle extends the bullish momentum and creates a price gap.
- The gap appears between the highest price of the first candle and the lowest price of the third candle.
This structure signals a strong bullish imbalance and indicates the possibility of continued upward movement.
How to Trade with BISI
To effectively trade using BISI:
- Identify the three-candle pattern in an existing uptrend.
- Confirm that the third candle creates a clear gap above the high of the first candle.
- Once the gap is confirmed, traders may enter a long position in anticipation of continued buying momentum.
- Implement stop-loss orders below the third candle’s low for risk management.
- Combine this setup with other tools like Order Blocks or liquidity pools to enhance trade accuracy.
What Is Sell-Side Imbalance and Buy-Side Inefficiency (SIBI)?
Sell-Side Imbalance and Buy-Side Inefficiency (SIBI) is the bearish counterpart of BISI. It reveals a market structure dominated by selling pressure, causing an inefficiency on the buy side.
Structure of SIBI
- The first candle is strongly bearish, initiating downward pressure.
- The second candle continues the bearish trend with a strong body.
- The third candle extends the decline and produces a gap.
- The gap is created between the lowest price of the first candle and the highest price of the third candle.
This gap signifies the presence of aggressive selling and the breakdown of buying support.
How to Trade with SIBI
To execute trades using SIBI:
- Identify the three-candle bearish sequence.
- Confirm the third candle forms a gap below the low of the first candle.
- Traders may enter a short position upon confirmation of the pattern.
- A stop-loss should be placed above the high of the third candle to manage risk.
- Additional confirmation via market structure shifts or liquidity sweeps can improve reliability.
Key Considerations When Using SIBI and BISI
- Always wait for confirmation before executing trades based on these patterns.
- Use risk management tools, including stop-loss and take-profit levels.
- Combine with other ICT concepts, such as Fair Value Gaps, Order Blocks, or Displacement Moves.
- These patterns are most effective when trading with the trend in high-probability environments.
Difference Between SIBI/BISI and Fair Value Gaps (FVG)
While similar to Fair Value Gaps, there are distinct differences in the structure and trend alignment of SIBI and BISI:
- SIBI/BISI are more likely to appear in strong trending markets, whereas FVGs can form in both trending and consolidating conditions.
- Both the first and third candles in SIBI and BISI follow the dominant trend, while in FVGs, this may not always be the case.
- The gap in SIBI/BISI often marks a more significant imbalance than a standard FVG.
Conclusion
The use of Sell-Side Imbalance and Buy-Side Inefficiency (SIBI) and Buy-Side Imbalance and Sell-Side Inefficiency (BISI) within the ICT trading methodology provides traders with actionable insight into the flow of institutional liquidity. These formations, while similar to Fair Value Gaps, offer enhanced clarity due to their structure and trend confirmation. Understanding and applying these concepts can significantly improve trade timing and decision-making, especially when combined with other ICT tools and confluence factors.