TP & SL Tool: Risk Reward Ratio Calculator RRR MT4 | Prop Firm Protector: Trade Assist Prop Firm Plus TF Expert MT4 | Money Management + DrawDown Protector: Trade Panel Prop Firm Drawdawn Limiter Pro MT4 |Get a free Expert Advisor license via Telegram and WhatsApp
In trending markets, Order Flow appears as corrective candles—pullbacks that temporarily counter the primary trend before price resumes its direction. These pullbacks reveal where Smart Money accumulates positions, providing traders with high-probability entry zones.
What Is ICT Market Order Flow?
ICT Market Order Flow is an institutional trading methodology that identifies Smart Money’s footprints in price action. Since large players cannot execute all trades at once, they distribute orders during corrections, creating Order Flow zones.
These zones often align with:
- Demand/Supply Zones
- Order Blocks
- PD Arrays (Premium/Discount Levels)
- Liquidity Pools
By analyzing OF, traders can anticipate where institutions are likely to enter, improving trade timing and accuracy.
How to Identify ICT Order Flow
To detect Order Flow, traders must first recognize Break of Structure (BOS)—a key concept in market structure analysis. Order Flow consists of pullback candles that form before a BOS.
Steps to Identify Order Flow:
- Mark the Break of Structure (BOS) – The point where price confirms a trend continuation.
- Track Pullback Candles – These corrective moves represent Order Flow.
- Classify OF Type – Determine if it’s Bullish OF (buy-side accumulation) or Bearish OF (sell-side distribution).
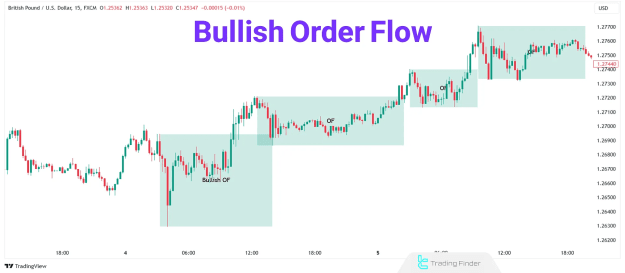
Bullish Order Flow: Trading with Institutional Demand
Bullish Order Flow occurs when Smart Money accumulates long positions during a downtrend correction. These zones are characterized by:
- Bearish pullback candles in an uptrend.
- Strong reactions near demand zones & bullish order blocks.
- Liquidity sweeps below key levels before reversal.
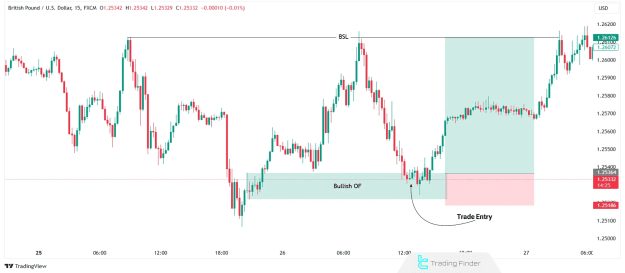
Trading Strategy for Bullish OF:
- Identify OF Zone – Mark pullback candles below BOS.
- Confirm Entry – Look for bullish reversal signals (e.g., MSS, engulfing patterns).
- Execute Trade – Enter long with SL below OF zone.
- Set TP Targets – Aim for previous highs or liquidity pools.
Example
On the GBP/USD 15-min chart, Bullish OF zones often align with demand zones, providing optimal buy entries.
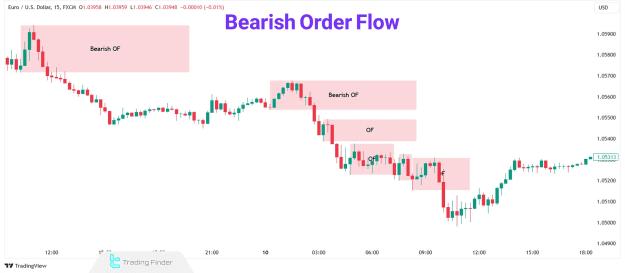
Bearish Order Flow: Trading with Institutional Supply
Bearish Order Flow appears when Smart Money distributes short positions during an uptrend correction. Key features include:
- Bullish pullback candles in a downtrend.
- Rejections near supply zones & bearish order blocks.
- Liquidity grabs above key levels before continuation.
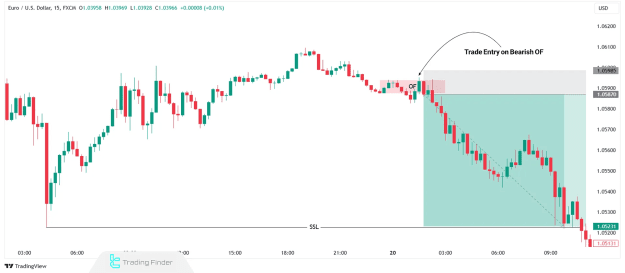
Trading Strategy for Bearish OF:
- Mark OF Zone – Highlight pullback candles above BOS.
- Validate Entry – Watch for bearish reversal signals (e.g., MSS, rejection candles).
- Place Trade – Enter short with SL above OF zone.
- Target TP Levels – Aim for previous lows or liquidity zones.
Example:
On the EUR/USD 15-min chart, Bearish OF zones often coincide with supply zones, offering high-probability sell setups.
Key Takeaways: Mastering ICT Order Flow
- Order Flow reveals Smart Money’s accumulation/distribution zones.
- Bullish OF = Demand-side entries; Bearish OF = Supply-side entries.
- Combine OF with BOS, MSS, and liquidity concepts for precision.
- Trade alignments with institutional flow increase success probability.
By integrating ICT Order Flow and SMC strategies, traders gain an edge in identifying high-probability setups, minimizing guesswork, and following Smart Money’s footprints effectively.
Conclusion
ICT Market Order Flow is a crucial concept for recognizing Smart Money participation within the market structure. By identifying and trading from these zones, retail traders can align themselves with institutional moves, improving the accuracy of trade entries and exits.