Introduction to 7 Technical Analysis Indicators
1. MACD Indicator (Moving Average Convergence Divergence)
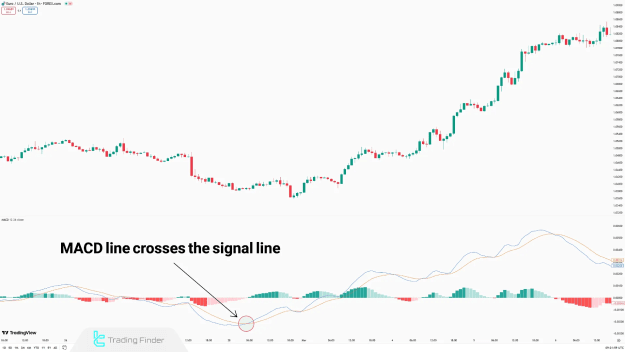
The MACD is a momentum-based oscillator that helps detect trend reversals and market momentum. It combines moving averages to provide medium- to long-term insights.
Key Signals from the MACD Indicator
- Crossover between MACD Line and Signal Line – Indicates potential trend shifts.
- Zero Line Crossover – Suggests bullish or bearish momentum.
- Price Divergence – Highlights possible trend reversals.
For higher accuracy, traders often combine MACD with support/resistance levels or classic chart patterns.
2. RSI (Relative Strength Index)
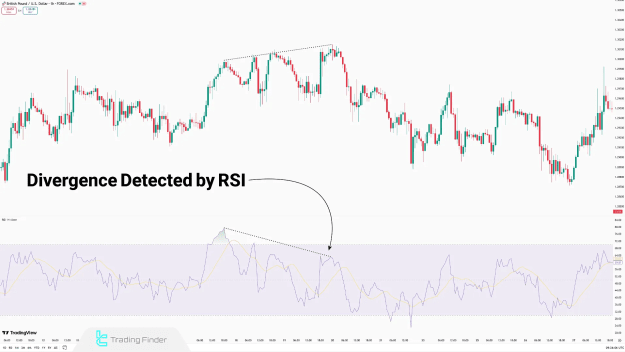
The RSI is a momentum oscillator that measures the speed and magnitude of price movements. It oscillates between 0 and 100, helping identify overbought (above 70) and oversold (below 30) conditions.
Key Signals from the RSI Indicator
- Overbought/Oversold Zones – Potential reversal points.
- Divergence Between Price and RSI – Signals weakening momentum.
RSI works best when combined with price action analysis.
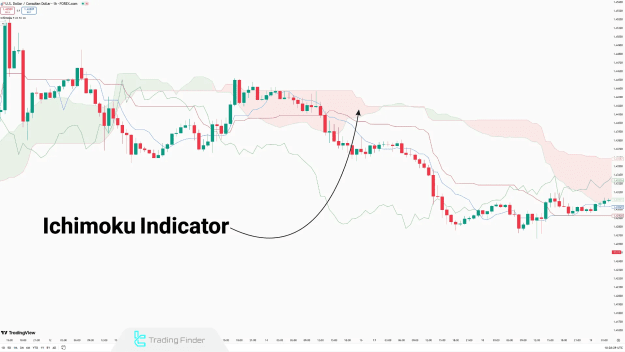
3. Ichimoku Cloud
The Ichimoku system is a comprehensive indicator that provides trend direction, support/resistance levels, momentum, and entry/exit signals. It consists of five components:
- Tenkan-sen (Conversion Line)
- Kijun-sen (Base Line)
- Senkou Span A (Leading Span A)
- Senkou Span B (Leading Span B)
- Chikou Span (Lagging Span)
Key Signals from Ichimoku
- Tenkan-sen/Kijun-sen Crossover – Entry/exit signals.
- Price Crossing the Kumo Cloud – Trend confirmation.
- Chikou Span Position – Confirms trend strength.
Unlike many indicators, Ichimoku can be used independently.
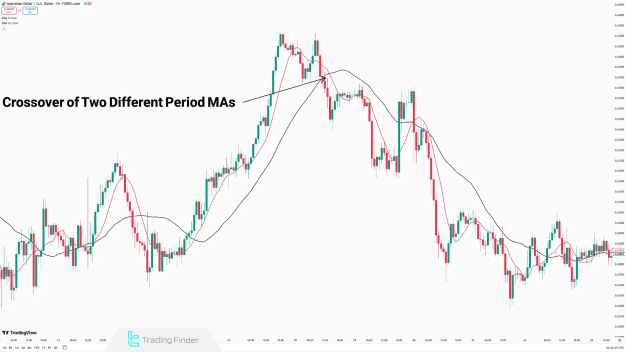
4. Moving Average (MA)
Moving Averages smooth price data to identify trends. The two main types are:
- Simple Moving Average (SMA) – Equal weight to all prices.
- Exponential Moving Average (EMA) – More weight to recent prices.
Key Signals from Moving Averages
- Price Crossing the MA – Trend reversal signal.
- MA Crossovers (e.g., 50 & 200 EMA) – Confirms trend changes.
- Slope Direction – Indicates trend strength.
MAs are highly adaptable and work well with other strategies.
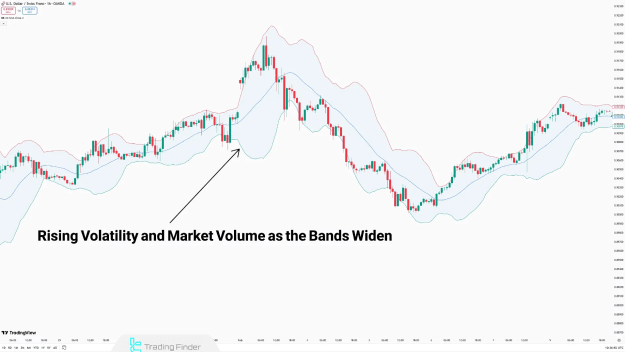
5. Bollinger Bands
Bollinger Bands measure volatility using an SMA and two outer bands (standard deviations). They help identify overbought/oversold conditions and potential breakouts.
Key Signals from Bollinger Bands
- Price Touching the Bands – Possible reversal or continuation.
- Band Expansion/Contraction – Indicates volatility changes.
- Price Moving Within the Channel – Trend continuation.
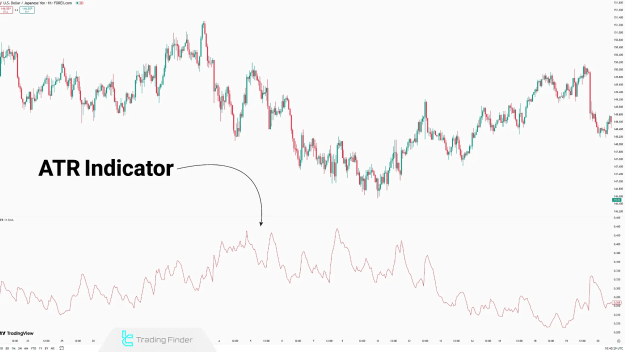
6. Average True Range (ATR)
The ATR measures market volatility, showing the average range of price movement. It does not indicate direction but helps assess trend strength.
Key Uses of ATR
- Setting Stop-Loss Levels – Based on volatility.
- Filtering Trade Signals – Confirms strong trends.
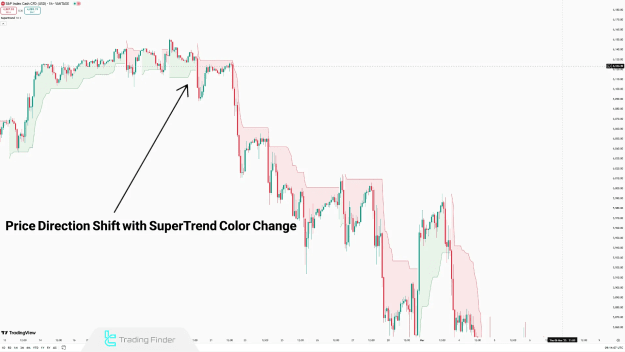
7. SuperTrend Indicator
The SuperTrend combines ATR and price action to generate buy/sell signals directly on the chart. Unlike RSI, it is a trend-following indicator.
Key Signals from SuperTrend
- Color Change (Green/Red) – Buy/sell signals.
- Line Position Relative to Price – Trend confirmation.
- Widening Gap Between Line and Price – Strong trend.
Pros and Cons of Technical Indicators
Advantages
![]() Simplifies price analysis.
Simplifies price analysis.
![]() Standardizes trading decisions.
Standardizes trading decisions.
![]() Works with multiple strategies.
Works with multiple strategies.
![]() Aids in risk management.
Aids in risk management.
![]() Useful for automated trading.
Useful for automated trading.
Disadvantages
![]() Lagging signals in fast markets.
Lagging signals in fast markets.
![]() False signals in ranging markets.
False signals in ranging markets.
![]() Over-reliance on indicator settings.
Over-reliance on indicator settings.
![]() May create overconfidence.
May create overconfidence.
![]() Ignores fundamental factors.
Ignores fundamental factors.
Conclusion
Selecting the right technical indicators depends on market structure, volatility, and trading style. Combining indicators—such as RSI divergence with MACD crossovers—enhances signal reliability. However, since all indicators rely on past data, traders should use them alongside other analysis methods for better accuracy.
By mastering these 7 technical analysis indicators, traders can improve their market predictions and refine their strategies.