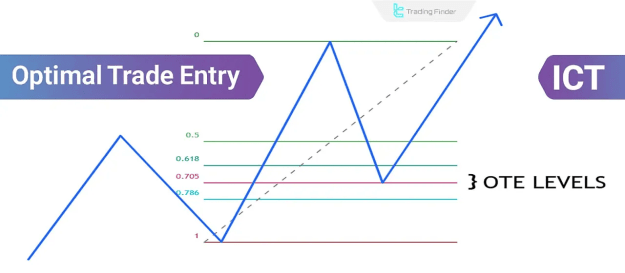
What Is the ICT OTE Trading Strategy?
The ICT OTE strategy is designed to locate optimal trade entry points during retracement phases within a prevailing trend. By leveraging Fibonacci tools and timing the entries within specific windows (often called ICT Kill Zones), traders can effectively enhance the accuracy of their positions.
Key Components of OTE in ICT Methodology
- Utilizes Fibonacci retracement levels for entry precision.
- Employs liquidity zones and order blocks as confluence factors.
- Focuses on specific intraday timeframes to optimize trade execution.
- Applies multi-timeframe analysis for trend confirmation.
Core Tools and Concepts Required for OTE Setup
To implement the OTE strategy efficiently, several analytical tools and technical concepts are essential:
Fibonacci Retracement Tool
The Fibonacci tool is fundamental to identifying OTE zones. Specific levels used for this setup include:
- Entry Zone:
- 62% (0.618)
- 70.5% (0.705)
- 79% (0.79)
- Stop-Loss Placement:
- 100% (1.0)
- Take-Profit Targets:
- 0
- -1
- -1.5
- -2
Order Blocks
- Zones of significant price reactions where institutional activity is likely.
- Derived from the final bullish/bearish candle before a major market move.
Liquidity Zones
- Areas with clustered stop-losses or pending orders.
- Used to validate liquidity grabs prior to entering a trade.
Multi-Timeframe Analysis
- Higher timeframes (e.g., daily or H4) to assess overall market structure.
- Lower timeframes (e.g., M15 or M5) for entry precision and structure confirmation.
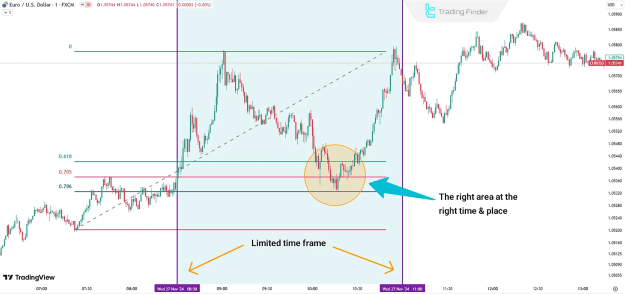
Specific Timing (ICT Kill Zones)
- The most effective window for OTE entries lies between 8:30 AM and 11:00 AM (New York time).
- Convert this time to your local zone for precision.
How to Execute the ICT OTE Strategy?
Step 1: Analyze the Market Trend (Higher Timeframe)
- Identify key market structure levels (highs and lows).
- Determine whether the trend favors long (uptrend) or short (downtrend) entries.
- Focus on pullback areas aligned with the trend direction.
Step 2: Identify Key Order Block
- In an uptrend: Locate the last bearish candle before a bullish impulse.
- In a downtrend: Locate the last bullish candle before a bearish drop.
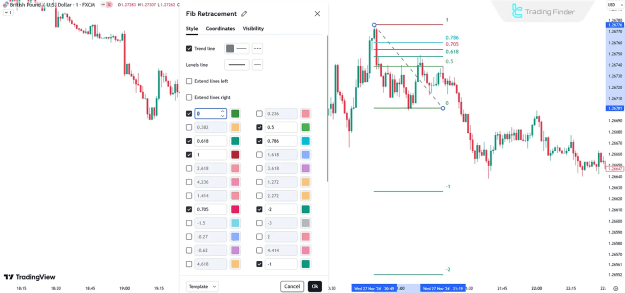
Step 3: Apply the Fibonacci Tool
- Use the most recent swing high and swing low to draw retracement levels.
- Confirm entry opportunities within the 62% to 79% Fibonacci zone.
Step 4: Confirm a Liquidity Grab
- Ensure price action has swept liquidity (e.g., a prior high or low).
- Look for stop-loss clusters targeted by market makers.
Step 5: Monitor the Timing Window
- Restrict entries to the 8:30 AM – 11:00 AM NY time window.
- Optimal entries occur during this period due to institutional activity.
Step 6: Look for Entry Triggers (Lower Timeframe)
- Confirm Break of Structure (BoS) or Market Structure Shift (MSS).
- Watch for retests of order blocks or the OTE zone.
- Validate entries with confirmation candles or momentum breaks.
Managing Trades Using the OTE Strategy
Proper risk and trade management are essential for long-term profitability.
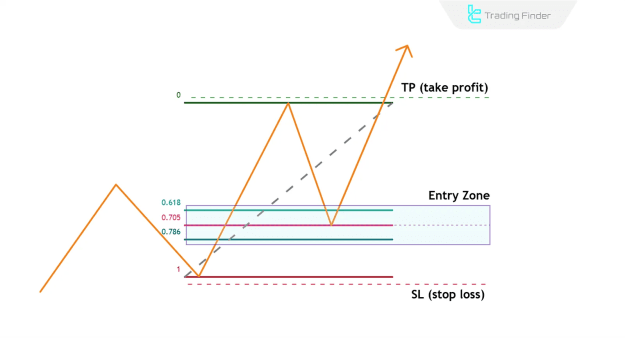
Entry, Stop Loss, and Take Profit
- Entry Zone: Between 0.618 – 0.79 retracement levels.
- Stop Loss:
- Above 100% Fibonacci level for bearish setups.
- Below 100% Fibonacci level for bullish setups.
- Take Profit:
- Opposite high/low from entry.
- Fibonacci extensions at -1, -1.5, or -2 levels.
Risk Management
- Risk only a fixed percentage per trade (e.g., 1% of total capital).
- Ensure a positive risk-to-reward ratio, preferably 1:2 or higher.
Note: Tools such as the One Shot One Kill Indicator from TradingFinder can enhance the effectiveness of this strategy when combined with the Market Maker Buy/Sell Model (MMXM).
OTE in Practice: Example Scenarios
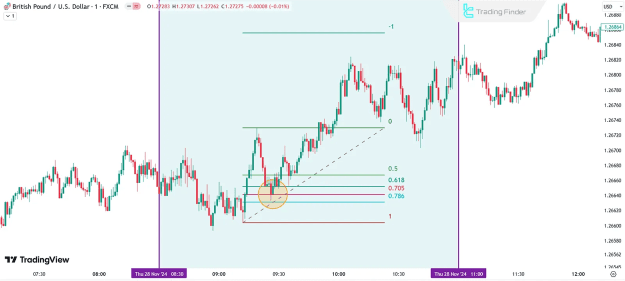
OTE in an Uptrend
- Market is trending upward on the daily chart.
- A bullish impulse breaks previous structure.
- Fibonacci drawn from swing low to swing high.
- During 8:30–11:00 AM NY time, price retraces to the 70.5% level.
- Entry is triggered; stop-loss placed below 100%, take-profit set at the previous high.
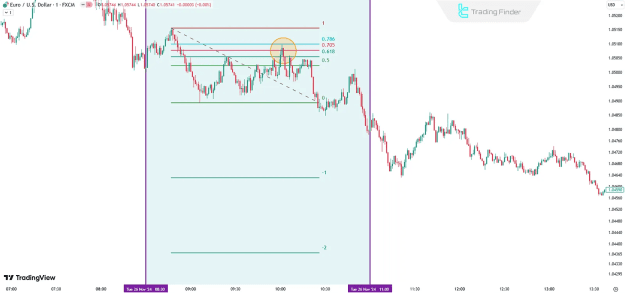
OTE in a Downtrend
- Market is in a confirmed downtrend.
- Price retraces into the 70.5% zone after a bearish impulse.
- Entry is taken during the ICT Kill Zone.
- Stop-loss placed above 100%; take-profit set at prior low or extension targets.
Key Guidelines for Successful OTE Trading
- Always start with higher timeframe analysis.
- Confirm that liquidity has been taken before entering a trade.
- Wait for clear structure breaks on lower timeframes.
- Adhere strictly to the designated entry window.
- Maintain discipline and sound risk management practices.
Common Mistakes to Avoid with the OTE Setup
- Ignoring the higher timeframe trend direction.
- Trading outside the optimal time window.
- Misplacing the Fibonacci levels (incorrect swings).
- Entering before liquidity is grabbed.
- Applying the strategy against the main market trend.
Best Markets for OTE Strategy
The ICT OTE strategy is highly effective in:
- Forex (due to its alignment with New York session liquidity).
- NYSE Stocks
- Futures
- Major Indices
However, it may be less effective in markets with low volatility or outside New York session influence.
Conclusion
The ICT OTE strategy offers traders a high-precision method to enter the market based on market structure, liquidity, and Fibonacci retracements. Its strength lies in the synergy of timing, technical confluence, and risk control.
Especially valuable for retail and intraday traders, this method fosters disciplined trading within well-defined parameters.