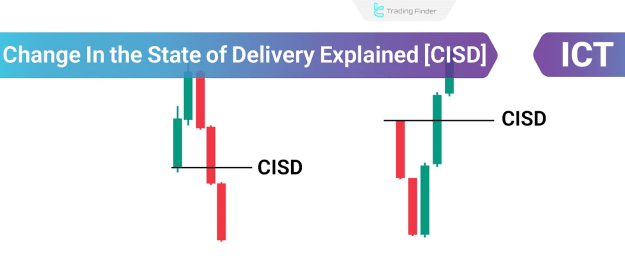
Change in the State of Delivery (CISD) Indicator:
Change in the State of Delivery (CISD) Indicator MT4
Change in the State of Delivery (CISD) Indicator MT5
Features of CISD
Quick Detection of Trend Reversals
- CISD offers an early signal of potential price reversals before a Market Structure Shift (MSS) occurs.
- It provides traders with a tactical advantage for early trade positioning.
Focused Analysis on Open and Close Prices
- Only the open and close of candlesticks are considered in CISD analysis.
- Wick data is disregarded to filter out price noise and enhance precision.
Cross-Market Applicability
- This method can be utilized across all asset classes, including forex, stocks, indices, and cryptocurrencies.
Technical Structure of the CISD Indicator
Multi-Timeframe Integration
- Higher Timeframes (e.g., Daily, Weekly): Confirm CISD signals with broader trend analysis.
- Lower Timeframes (e.g., 15-Minute, 1-Hour): Pinpoint precise entry and exit positions.
- Combined Timeframe Analysis: Strengthens signal accuracy and trading decisions.
Order Block Identification
- Bullish Order Blocks: Bearish candles that follow a bullish CISD act as future support zones.
- Bearish Order Blocks: Bullish candles following a bearish CISD transform into resistance areas.
Market Timing Relevance
- Key Trading Sessions: CISD signals are more reliable during high-volume periods such as the London or New York sessions.
- Economic Releases: If a CISD occurs during high-impact news, it represents market sentiment in response to new economic data.
Distinguishing CISD from Market Structure Shift (MSS)
While both tools serve important purposes in ICT trading, they differ fundamentally:
CISD:
- Focus: Shift in buyer/seller dominance.
- Analysis Level: Candle body analysis (open and close).
- Timeframe: Short-term trend shifts and intraday strategies.
MSS:
- Focus: Breaks in major market structure.
- Analysis Level: Key levels and structural breakouts.
- Timeframe: Long-term trend transitions.
How to Apply CISD in Practical Trading
Step 1: Begin with Higher Timeframe Analysis
- Evaluate the overall market direction using larger timeframes (4H, Daily).
- Use supplementary ICT tools such as Market Structure and PD Arrays for directional bias.
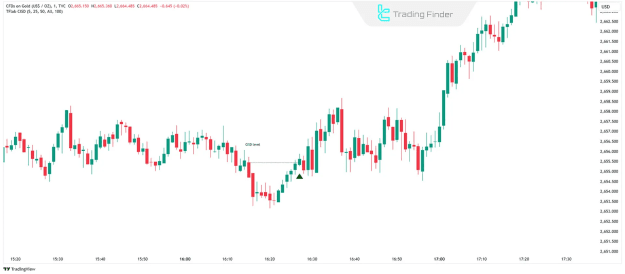
Step 2: Identify CISD on Lower Timeframes
- Switch to smaller timeframes (15-minute, 5-minute) to locate real-time CISD formations.
Step 3: Integrate Supporting Tools
- Use MSS, Order Blocks, and Fair Value Gaps (FVGs) to validate signals and refine entry points.
- Employ tools like the One Shot One Kill indicator from TradingFinder to combine CISD with strategies such as the Market Maker Buy and Sell Model (MMXM).
Step 4: Risk Management Protocol
- Stop Loss: Position behind the nearest Order Block or FVG for protection.
- Take Profit: Target prior highs/lows or trade within defined premium and discount zones.
CISD Use Case: Buy and Sell Scenarios
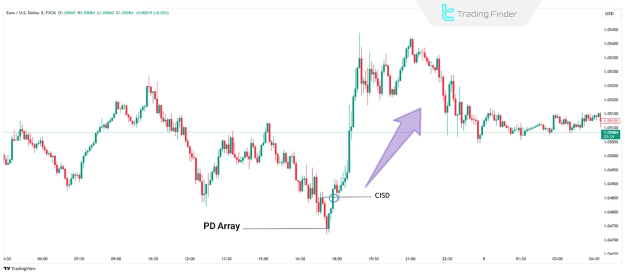
CISD in Bullish Trades
- A bullish CISD is formed when price closes above the opening price of one or more preceding bearish candles.
- This reflects a decline in selling momentum, indicating a possible upward reversal.
- Order Blocks or FVGs serve as strategic entry points for long positions.
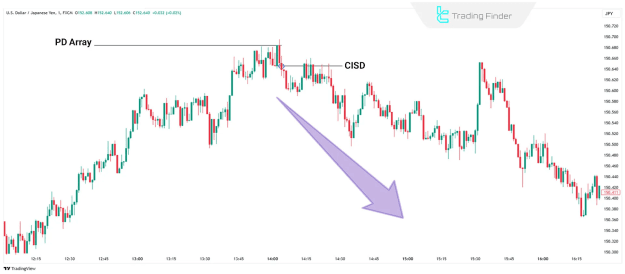
CISD in Bearish Trades
- A bearish CISD forms when price closes below the opening price of one or more preceding bullish candles.
- This demonstrates weakness in buying pressure, signaling a potential downward move.
- Use resistance zones and FVGs to enter short positions confidently.
Conclusion
The CISD (Change in the State of Delivery) technique is a powerful ICT-based tool for detecting short-term market reversals and entry opportunities. By focusing on candlestick open and close prices, CISD enables traders to make informed decisions based on subtle shifts in buyer and seller strength.
In combination with other ICT tools such as MSS, Order Blocks, and FVGs, CISD empowers traders to refine their strategy, manage risk effectively, and enhance trading performance across various markets and timeframes.