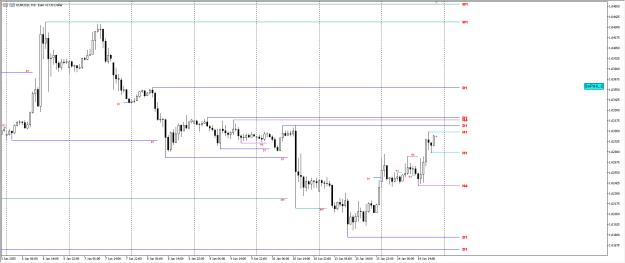
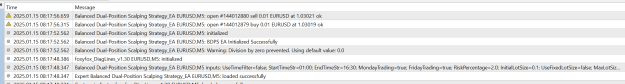
DislikedGreetings... I'm making this indicator with the idea that it shows what liquidity and what time frame the price is taking and what the next one would be... so I "should" do the following: 1) Draw a line in each High/Low Swing that has not been liquidated in each time frame 2) Draw the last H/L Swing taken 3) Draw the PXH/PXL of monthly, weekly and daily that have not been taken 4) Draw the last PXH/PXL of MN1,W1,D1 that were taken I managed to do it but it has errors because it does not update automatically (in the capture you will see the errors):...Ignored
Attached File(s)
2