Today we will close -230 points from the DO. Being a friday, Come Monday will be a bearish open .. and continuation of the dump.
Ignored
Everything points on that, i want to spot where i can engage...
Already identify when my plan change bias, until then i am bearish.
In a daily of course.
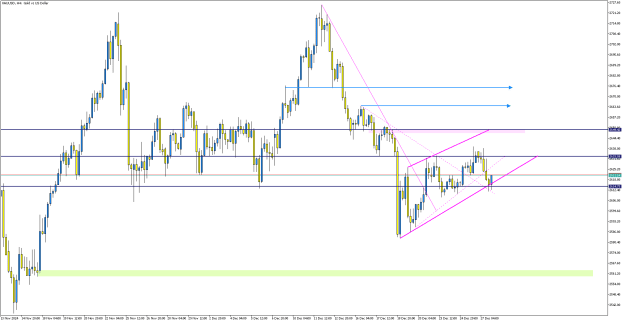
Just to see how market is erratic, in a price action perspective Monthly still want 2536.855, but instead Weekly wants 2664.475 or 2583.915 because it sweep both sides on daily.
If weekly complete is objective but don't close above that bullish price Monthly still in play for bearish.
Today closing above 2615.310 we can have a weekly playing out first to the upside, so caution.
As a day trader i will keep in mind 2624.120 to start seeing a daily shift.
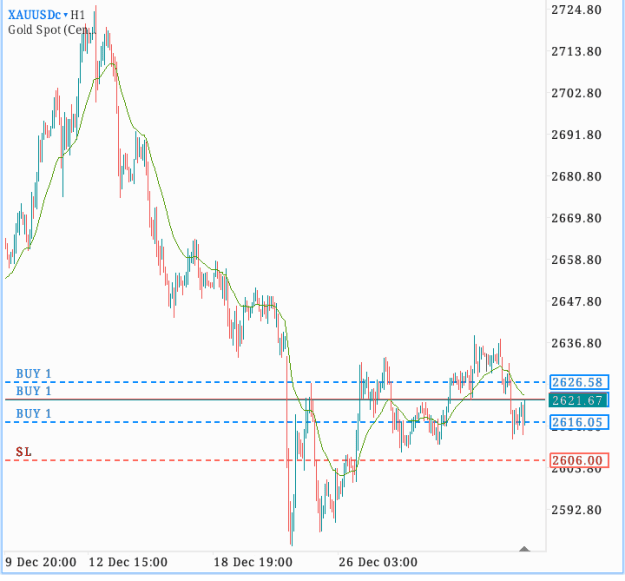
{quote} In a sell limit orders, i would say two prices. 2618.655 SL 2621.485 TP the Low of Friday at least 2626.370 Sl 2628.945 Tp the low again, but here i do not want to see a 4H candle closing above 2624.120 For me is my first plan for monday, untill market doesn't give new clues. EDIT: Obvious i will trade live, but without time it was my choices....
Ignored
Don't take this for granted, because again 2618.655 hit again...
Monday will give a setup whichever way it want to go...
Just to see how market is erratic, in a price action perspective Monthly still want 2536.855, but instead Weekly wants 2664.475 or 2583.915 because it sweep both sides on daily. If weekly complete is objective but don't close above that bullish price Monthly still in play for bearish. Today closing above 2615.310 we can have a weekly playing out first to the upside, so caution. As a day trader i will keep in mind 2624.120 to start seeing a daily shift.
{quote} Yes, the ranges are based on historical levels, initially drawn—or, let’s say, tracked—when gold was trading at $550 an ounce, as noted in my article. The parabolic movements in gold’s price were monitored from the time it reached $1,614, as shown in the charts. These ranges were established on the specified dates and reflect what I was observing back in 2022. You might also find this link interesting: https://thepraetorion.blogspot.com/, a blog I authored in 2010. It was written out of my dislike for herd mentality. Back when...
Ignored
Amazing. Great to read something carefully written on this thread!
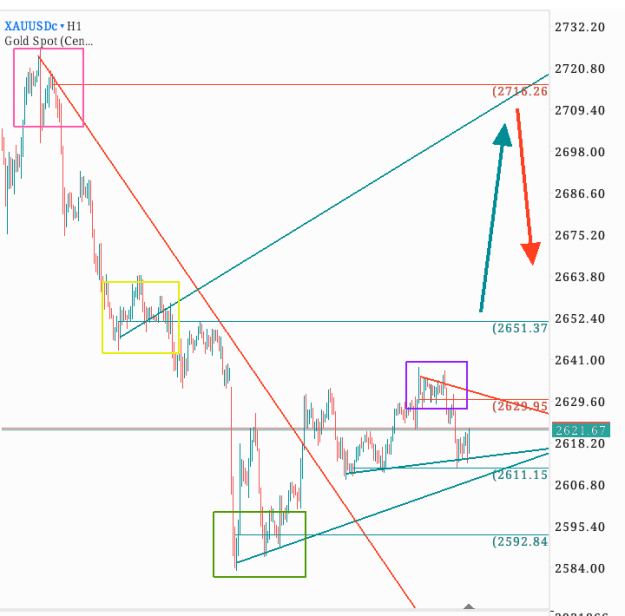
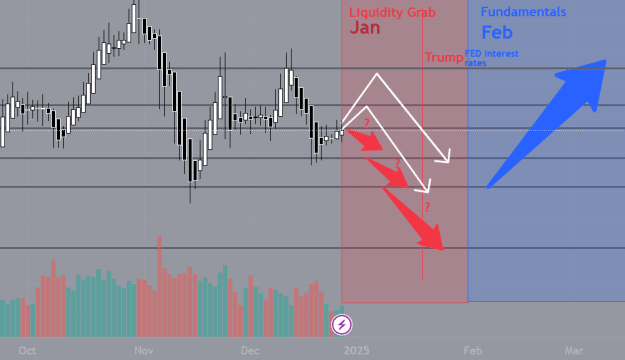
Yes, a Huge Liquidity grab could be ahead before golds strengthening, Jan 2025 is interesting for sure.
- Price action says reversal.
- Fundamentals call long.
-> buy the dip
Yes and now 2618.655 can be turn Demand to engage to the high of friday, so caution.
I prefer to have a chance of confirmation with a 4H closing above 2624.120 and then see a sweep of a bullish 4H candle.
Basically is the opposite to the bearish side.
Keeping in mind if it don't close above 2624.120 in 4H bearish setup is also possible. For the bearish side i really do not want to see this happen, price can retrace to demand first before attack the highs.
With no sweeps it can happen also but very rare. Engage without that usual is to be stoped out.
Joined Dec 2018
|
Status: Big Operator
|4,525 Posts
Attached Image (click to enlarge)
First of all, technical analysis is not biased as to what the market is doing. In fact, it tells you everything the market is doing, but we as humans only choose to see what we want to see and believe that the market is doing. In the end, "everyone gets what they want from the market"- Ed Seykota.
Attached Image (click to enlarge)
My positions show what I have chosen to see and believe the market is doing. The goal is not to earn arguments on a public fora, but to make money and earn a descent living trading.
Got ya! Chicken head.
{image} First of all, technical analysis is not biased as to what the market is doing. In fact, it tells you everything the market is doing, but we as humans only choose to see what we want to see and believe that the market is doing. In the end, "everyone gets what they want from the market"- Ed Seykota.{image} My positions show what I have chosen to see and believe the market is doing. The goal is not to earn arguments on a public fora, but to make money and earn a descent living trading. Got ya! Chicken head.
Ignored
True.
I'm quite biased myself, since I don't know do I see, or want to see a starting bull run, since fundamentals are in the back of my mind --
but liquidity grab is needed <- why ? - sl orders on 2590, 2560, 2530, 2480
- increasing trading volume (https://www.gold.org/goldhub/data/go...in-type=google)
- institutional accumulation, central banks slowing on buying gold reserves https://www.gold.org/goldhub/researc.../central-banks
- conflicting interest rate policy (https://tradingeconomics.com/united-.../interest-rate), raising interest rate projection, and raising inflation projection, while trump wants to lower rates -> unclear signs for the next meeting on Jan 30-31.
- on Dec 18. after Fed's meeting, even though FED lowered interest rates, gold surged 2% intraday, since they increased their interest rate projections. 25 basis point rate cut was expected... but increasing long-term interest rate projection was not, especially after trumps winning. Powell is still in office for 1,5 years. Interesting. (https://www.cnbc.com/2024/12/18/fed-...ber-2024-.html)
-> gold will temporarily move in the opposite direction of the anticipated trend, creating volatility and pulling in liquidity (capitaaalll)
as Isabella stated here this fall, technicals call for a liquidity grab to levels as 24X0.
{quote} Yes, the ranges are based on historical levels, initially drawn—or, let’s say, tracked—when gold was trading at $550 an ounce, as noted in my article. The parabolic movements in gold’s price were monitored from the time it reached $1,614, as shown in the charts. These ranges were established on the specified dates and reflect what I was observing back in 2022. You might also find this link interesting: https://thepraetorion.blogspot.com/, a blog I authored in 2010. It was written out of my dislike for herd mentality. Back when...
If and when Trump starts pushing economic growth, we'll see lot of misleading data. By lowering the interest rates or in general attempting to increase the monetary supply in the economy, we'll see employment rates rising-> but at what cause? the short term higher employment will only delay and exacerbate the state of US economy. Rapidly increasing money supply, lowering rates, accelerate inflation will create only momentary jobs. Kicking the can down the road. Borrowing from the future...
rapid moves will stimulate growth temporarily but lead to significant consequences later.
{quote} True. I'm quite biased myself, since I don't know do I see, or want to see a starting bull run, since fundamentals are in the back of my mind -- but liquidity grab is needed <- why ? - sl orders on 2590, 2560, 2530, 2480 - increasing trading volume (https://www.gold.org/goldhub/data/go...in-type=google) - institutional accumulation, central banks slowing on buying gold reserves https://www.gold.org/goldhub/researc.../central-banks - conflicting...
Ignored
Yeah Chief! I get you... Well said.
But, what retail traders like most of us should understand is that, our capital is comparatively small for the long term projection and speculation that we engage in.
There is absolutely no use speculating for the purpose of saying "I told you so"- we will get this truth sooner than later.
The bottom line is... 1. Are we making money doing what we do? 2. Are we getting better at it?
Trading for me is nothing less than a business.
Has someone knowledge on, how the rising demand for cryptos will / could affect gold?
Could BTC become the new reserve currency, as new rules of the game and standard LLM models are set?
.. look again .. your Trading Below todays DO, breached Yesterdays DO, and Mondays DO
Ignored