chivass88chi "maja" smallville-personal-laboratory
personal department of de Ja Vu engine
copy right code: de..javu...1441285j9u1lÄ9i717981169
\\\\\\\\\\*********************************************
*\\\\\\\\\\********************************************
T H E G B P / U S D B E H A V I O R O F
8 9 S M A C L O S E O N L Y
on hourly wave
*******************************************************
FX de Ja vu engine
research with
hourly data since month4 day30 / 2006
till 24 may 2007
with 9222 hourly candle data amount
on GBP/USD
I use the compared
data from some of european
dealer services
********************* the B I G result ***************
CLOSE above SMA BETWEEN 12 pip AND 321 PIP........ 93.7 %
CLOSE BELOW 89 SMA-close.......4303 times........ 46.6606 %
CLOSE ABOVE 89 SMA-close.......4919 times.......... 53.339 %
CLOSE LESS THAN 285 PIP below 89 SMA-C............... 100 %
CLOSE MORE THAN 285 PIP below 89 SMA-C................. 0 %
CLOSE more than 111 PIP ABOVE 89 SMA-Close ......... 10 %
CLOSE less then 100 PIP BELOW 89 SMA-Close .......... 90 %
CLOSE MORE THAN 313 PIP ABOVE 89 SMA -C ---ONCE ONLY
during the test
*************** end of the big result *****************
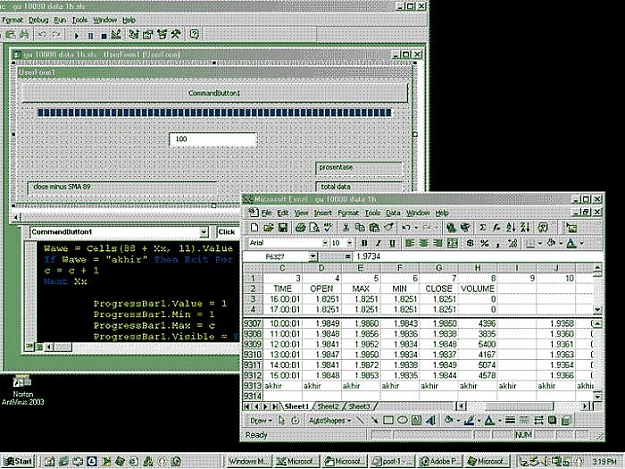
source code of VBA excel is used for data testing
if you want it.........
please make a asking
with ancient letter
for the complete software
for absolutely freeeeeeee..............................
with all species of Moving average
:-D
========================= here is the source code ==
========================= to proof it ==
========================= here is the source code ==
========================= please see the gif file ==
''''Private Sub CommandButton1_Click()
''''d = 0
''''c = 0
''''mark1 = TextBox1.Value
''''mark = mark1 / 10000
''''For Xx = 1 To 10000
''''Wawe = Cells(90 + Xx, 11).Value
''''If Wawe = "akhir" Then Exit For
''''c = c + 1
''''Next Xx
''''ProgressBar1.Value = 1
''''ProgressBar1.Min = 1
''''ProgressBar1.Max = c
''''ProgressBar1.Visible = True
''''prog = 1
''''For X = 1 To c
''''Wawe = Cells(90 + X, 11).Value
''''If Wawe > mark Then d = d + 1
''''ProgressBar1.Value = prog
''''prog = prog + 1
''''Next X
''''Label1.Caption = "close minus MA 89 > " & mark1 & "pip =" & d
''''Label2.Caption = "total data = " & c
''''Label3.Caption = (d / c) * 100 & " %"
''''End Sub
===============================end of source code
trading with artificial intelligence will be next
===============================end of source code
ask me for free
the historical data
when you need it
------------------
personal department of de Ja Vu engine
copy right code: de..javu...1441285j9u1lÄ9i717981169
\\\\\\\\\\*********************************************
*\\\\\\\\\\********************************************
T H E G B P / U S D B E H A V I O R O F
8 9 S M A C L O S E O N L Y
on hourly wave
*******************************************************
FX de Ja vu engine
research with
hourly data since month4 day30 / 2006
till 24 may 2007
with 9222 hourly candle data amount
on GBP/USD
I use the compared
data from some of european
dealer services
********************* the B I G result ***************
CLOSE above SMA BETWEEN 12 pip AND 321 PIP........ 93.7 %
CLOSE BELOW 89 SMA-close.......4303 times........ 46.6606 %
CLOSE ABOVE 89 SMA-close.......4919 times.......... 53.339 %
CLOSE LESS THAN 285 PIP below 89 SMA-C............... 100 %
CLOSE MORE THAN 285 PIP below 89 SMA-C................. 0 %
CLOSE more than 111 PIP ABOVE 89 SMA-Close ......... 10 %
CLOSE less then 100 PIP BELOW 89 SMA-Close .......... 90 %
CLOSE MORE THAN 313 PIP ABOVE 89 SMA -C ---ONCE ONLY
during the test
*************** end of the big result *****************
source code of VBA excel is used for data testing
if you want it.........
please make a asking
with ancient letter
for the complete software
for absolutely freeeeeeee..............................
with all species of Moving average
:-D
========================= here is the source code ==
========================= to proof it ==
========================= here is the source code ==
========================= please see the gif file ==
''''Private Sub CommandButton1_Click()
''''d = 0
''''c = 0
''''mark1 = TextBox1.Value
''''mark = mark1 / 10000
''''For Xx = 1 To 10000
''''Wawe = Cells(90 + Xx, 11).Value
''''If Wawe = "akhir" Then Exit For
''''c = c + 1
''''Next Xx
''''ProgressBar1.Value = 1
''''ProgressBar1.Min = 1
''''ProgressBar1.Max = c
''''ProgressBar1.Visible = True
''''prog = 1
''''For X = 1 To c
''''Wawe = Cells(90 + X, 11).Value
''''If Wawe > mark Then d = d + 1
''''ProgressBar1.Value = prog
''''prog = prog + 1
''''Next X
''''Label1.Caption = "close minus MA 89 > " & mark1 & "pip =" & d
''''Label2.Caption = "total data = " & c
''''Label3.Caption = (d / c) * 100 & " %"
''''End Sub
===============================end of source code
trading with artificial intelligence will be next
===============================end of source code
ask me for free
the historical data
when you need it
------------------
Attached Image (click to enlarge)
Attached File(s)