hi coder
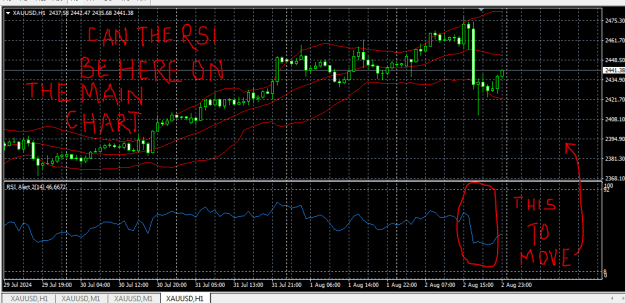
can any one make mtf rsi table indicator mt4
pine code
in trading view
//@version=4
//Modified The source from BeeHolder "Performance" indicator.
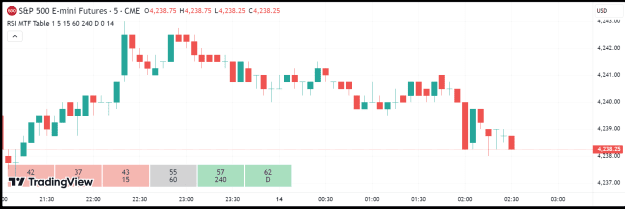
//This indicator tells different Timeframe of RSI value within Table.
//Customized the great work done by sxw6329 to add in more options on colors, text and transparency
//now one horizontal row with seven resolutins to accommodate weekly
study("RSI MTF Table", overlay=true)
var table perfTable = table.new(position.bottom_left, 7, 1, border_width = 2)
rstime1 = input(title="Resolution 1", type = input.resolution, defval = "1")
rstime2 = input(title="Resolution 2", type = input.resolution, defval = "5")
rstime3 = input(title="Resolution 3", type = input.resolution, defval = "15")
rstime4 = input(title="Resolution 4", type = input.resolution, defval = "60")
rstime5 = input(title="Resolution 5", type = input.resolution, defval = "240")
rstime6 = input(title="Resolution 6", type = input.resolution, defval = "D")
rstime7 = input(title="Resolution 7", type = input.resolution, defval = "W")
cell_up_max = input(#229954,'Max Bullish Cell Color' ,group='Style Settings')
cell_up_med = input(#52BE80,'Med Bullish Cell Color' ,group='Style Settings')
cell_up_min = input(#A9DFBF,'Min Bullish Cell Color' ,group='Style Settings')
cell_dn_max = input(#CB4335,'Max Bearish Cell Color' ,group='Style Settings')
cell_dn_med = input(#EC7063,'Med Bearish Cell Color' ,group='Style Settings')
cell_dn_min = input(#F5B7B1,'Min Bearish Cell Color' ,group='Style Settings')
txt_col = input(color.black,'Text/Frame Color'
,group='Style Settings')
cell_transp = input(0,'Cell Transparency'
,minval=0
,maxval=100
,group='Style Settings')
len = input(14, minval=1, title="Length")
up = rma(max(change(close), 0), len)
down= rma(-min(change(close), 0), len)
vsi1 = security(syminfo.tickerid, rstime1, down == 0 ? 100 :up == 0 ? 0 : 100 - (100 / (1 + up/ down)))
vsi2 = security(syminfo.tickerid, rstime2, down == 0 ? 100 :up == 0 ? 0 : 100 - (100 / (1 + up / down)))
vsi3 = security(syminfo.tickerid, rstime3, down == 0 ? 100 :up == 0 ? 0 : 100 - (100 / (1 + up/ down)))
vsi4 = security(syminfo.tickerid, rstime4, down == 0 ? 100 :up == 0 ? 0 : 100 - (100 / (1 + up/ down)))
vsi5 = security(syminfo.tickerid, rstime5, down == 0 ? 100 :up == 0 ? 0 : 100 - (100 / (1 + up/ down)))
vsi6 = security(syminfo.tickerid, rstime6, down == 0 ? 100 :up == 0 ? 0 : 100 - (100 / (1 + up/ down)))
vsi7 = security(syminfo.tickerid, rstime7, down == 0 ? 100 :up == 0 ? 0 : 100 - (100 / (1 + up/ down)))
f_fillCell(_table, _column, _row, _value, _timeframe) =>
_c_color = _value >=75? cell_up_max : _value <75 and _value >=65? cell_up_med : _value <65 and _value >=55? cell_up_min : _value <= 45 and _value >35? cell_dn_min : _value <=35 and _value >25? cell_dn_med : _value <= 25? cell_dn_max : #D3D3D3
_cellText = tostring(_value, "0") + "\n" + _timeframe
table.cell(_table, _column, _row, _cellText, bgcolor = color.new(_c_color, cell_transp), text_color = txt_col, width = 8)
if barstate.islast
f_fillCell(perfTable, 0, 0, vsi1, rstime1)
f_fillCell(perfTable, 1, 0, vsi2, rstime2)
f_fillCell(perfTable, 2, 0, vsi3, rstime3)
f_fillCell(perfTable, 3, 0, vsi4, rstime4)
f_fillCell(perfTable, 4, 0, vsi5, rstime5)
f_fillCell(perfTable, 5, 0, vsi6, rstime6)
f_fillCell(perfTable, 6, 0, vsi7, rstime7)
can any one make mtf rsi table indicator mt4
pine code
in trading view
//@version=4
//Modified The source from
//This indicator tells different Timeframe of RSI value within Table.
//Customized the great work done by sxw6329 to add in more options on colors, text and transparency
//now one horizontal row with seven resolutins to accommodate weekly
study("RSI MTF Table", overlay=true)
var table perfTable = table.new(position.bottom_left, 7, 1, border_width = 2)
rstime1 = input(title="Resolution 1", type = input.resolution, defval = "1")
rstime2 = input(title="Resolution 2", type = input.resolution, defval = "5")
rstime3 = input(title="Resolution 3", type = input.resolution, defval = "15")
rstime4 = input(title="Resolution 4", type = input.resolution, defval = "60")
rstime5 = input(title="Resolution 5", type = input.resolution, defval = "240")
rstime6 = input(title="Resolution 6", type = input.resolution, defval = "D")
rstime7 = input(title="Resolution 7", type = input.resolution, defval = "W")
cell_up_max = input(#229954,'Max Bullish Cell Color' ,group='Style Settings')
cell_up_med = input(#52BE80,'Med Bullish Cell Color' ,group='Style Settings')
cell_up_min = input(#A9DFBF,'Min Bullish Cell Color' ,group='Style Settings')
cell_dn_max = input(#CB4335,'Max Bearish Cell Color' ,group='Style Settings')
cell_dn_med = input(#EC7063,'Med Bearish Cell Color' ,group='Style Settings')
cell_dn_min = input(#F5B7B1,'Min Bearish Cell Color' ,group='Style Settings')
txt_col = input(color.black,'Text/Frame Color'
,group='Style Settings')
cell_transp = input(0,'Cell Transparency'
,minval=0
,maxval=100
,group='Style Settings')
len = input(14, minval=1, title="Length")
up = rma(max(change(close), 0), len)
down= rma(-min(change(close), 0), len)
vsi1 = security(syminfo.tickerid, rstime1, down == 0 ? 100 :up == 0 ? 0 : 100 - (100 / (1 + up/ down)))
vsi2 = security(syminfo.tickerid, rstime2, down == 0 ? 100 :up == 0 ? 0 : 100 - (100 / (1 + up / down)))
vsi3 = security(syminfo.tickerid, rstime3, down == 0 ? 100 :up == 0 ? 0 : 100 - (100 / (1 + up/ down)))
vsi4 = security(syminfo.tickerid, rstime4, down == 0 ? 100 :up == 0 ? 0 : 100 - (100 / (1 + up/ down)))
vsi5 = security(syminfo.tickerid, rstime5, down == 0 ? 100 :up == 0 ? 0 : 100 - (100 / (1 + up/ down)))
vsi6 = security(syminfo.tickerid, rstime6, down == 0 ? 100 :up == 0 ? 0 : 100 - (100 / (1 + up/ down)))
vsi7 = security(syminfo.tickerid, rstime7, down == 0 ? 100 :up == 0 ? 0 : 100 - (100 / (1 + up/ down)))
f_fillCell(_table, _column, _row, _value, _timeframe) =>
_c_color = _value >=75? cell_up_max : _value <75 and _value >=65? cell_up_med : _value <65 and _value >=55? cell_up_min : _value <= 45 and _value >35? cell_dn_min : _value <=35 and _value >25? cell_dn_med : _value <= 25? cell_dn_max : #D3D3D3
_cellText = tostring(_value, "0") + "\n" + _timeframe
table.cell(_table, _column, _row, _cellText, bgcolor = color.new(_c_color, cell_transp), text_color = txt_col, width = 8)
if barstate.islast
f_fillCell(perfTable, 0, 0, vsi1, rstime1)
f_fillCell(perfTable, 1, 0, vsi2, rstime2)
f_fillCell(perfTable, 2, 0, vsi3, rstime3)
f_fillCell(perfTable, 3, 0, vsi4, rstime4)
f_fillCell(perfTable, 4, 0, vsi5, rstime5)
f_fillCell(perfTable, 5, 0, vsi6, rstime6)
f_fillCell(perfTable, 6, 0, vsi7, rstime7)
Attached Image (click to enlarge)