{quote} check this one first - if it helps you then i can do the same to all of them {file}
Ignored
Hi l checked it but make it not to recolouring previous candles. and add arrows if possible but if not possible just make not to recolour previous candles
{quote} Hi l checked it but make it not to recolouring previous candles. and add arrows if possible but if not possible just make not to recolour previous candles
Ignored
please show them to me by comparing both versions and i will see if i can do it - i m very limited in coding.
good evening great Programmers,
hope you guys are doing amazing.
I really need your help to build one indicator (called it A) that can load another indicator (called it B) with specific set files by clicking hotkeys or that indicator(A) can change set files for already loaded indicator(B).
I understand you guys says why not save as template and load again but this is different case.
example
suppose I open chart of eurusd and add MA with 30 period (this can be any indicator) and I save set file in preset folder with name 30ma.set and another I create set file with different properties like 60 period of same indicator with name 60ma.set.
now i load indicator(A) and in properties i already input all details and setfiles name and path, like i set hotkey 3 with 30ma.set and 6 with 60ma.set. when i press 6 that MA suppose perform like 60 period and when i press 3 MA suppose perform 30 period.
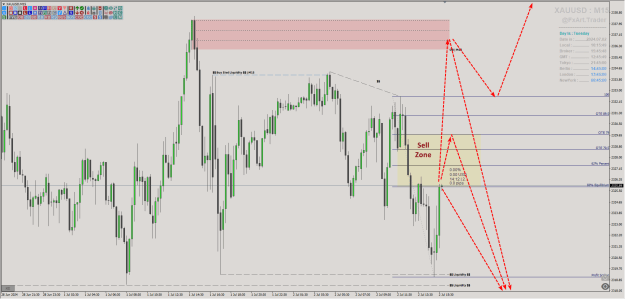
I'm hoping someone can help me out. I'm working on improving my SMC/ICT analysis through market mapping, and I'm looking for a specific indicator. I've attached a screenshot of what I'm looking for
Attached Image (click to enlarge)
Does anyone recognize this indicator, or know if it's available within the group? If not, would anyone be able to code something similar? Ideally, the indicator would allow me to draw on the chart:
good evening great Programmers, hope you guys are doing amazing. I really need your help to build one indicator (called it A) that can load another indicator (called it B) with specific set files by clicking hotkeys or that indicator(A) can change set files for already loaded indicator(B). I understand you guys says why not save as template and load again but this is different case. example suppose I open chart of eurusd and add MA with 30 period (this can be any indicator) and I save set file in preset folder with name 30ma.set and another I create...
Ignored
That's not possible.
You can, however, create multiple copies of your indicator, changing the default inputs, naming them accordingly, and assigning hotkeys directly in the navigator.
Otherwise it is impossible to apply a preset without applying a template.
Or, you can build a custom indicator designed to do what you want.
This means an indicator which allows for multiple settings and some switching mechanism, like button(s).
.ex4/.ex5 files can't be fixed or modified / I'm not a coder!
{quote} That's not possible. You can, however, create multiple copies of your indicator, changing the default inputs, naming them accordingly, and assigning hotkeys directly in the navigator. Otherwise it is impossible to apply a preset without applying a template. Or, you can build a custom indicator designed to do what you want. This means an indicator which allows for multiple settings and some switching mechanism, like button(s).
Ignored
Then it's possible to change default sets of Indicator, so I can copy multiple same indicators with different setting but I don't have source code of some file, is still possible to change default settings.
{quote} Then it's possible to change default sets of Indicator, so I can copy multiple same indicators with different setting but I don't have source code of some file, is still possible to change default settings.
Ignored
If you don't have the source code, you can code a custom indicator using iCustom(), thus getting the data from the ex4 which you have.
You just need to input into the iCustom() the parameters which you want. https://docs.mql4.com/indicators/icustom
.ex4/.ex5 files can't be fixed or modified / I'm not a coder!
{quote} First, the visibility Tf is read from the rectangle OBJPROP_TIMEFRAMES, so that's it. My indicator can not get this information from anywhere else. About the problem with dleteing objects on Tf change - you are correct, I overlooked this issue. Now they will be deleted only when the indicator is removed. Be right back! ...... 2000 Years Later.... OK, I got the labels right, now. {file}
Ignored
Thank for your effort sir it's appreciated , but it's only showing in which timeframe (eg 1H) the object place, what if i put description in settings like "Zone" but it's showing 1H.
Hello coders! By any chance could anyone translate this Tradingview indicator into MT5?
Inserted Code
//@version=5
indicator(title="Relational Quadratic Kernel Channel [Vin]", shorttitle = "RQK-Channel-V", overlay=true, timeframe = "", timeframe_gaps = false)

// Import (latest) external library
import vinayakavajiraya/RationalQuadraticKernelFunction/2 as kernel

// Inputs //
// Input parameters for the kernel estimate
length = input.int(title="Lookback Window", defval=42, minval=1, step=1, group="Kernel Estimate", tooltip="The number of previous bars to consider when calculating the rationalQuadraticEstimate. Higher values capture longer-term trends.")
relativeWeight = input.float(title="Relative Weight", defval=27, minval=1, step=1, group="Kernel Estimate", tooltip="A factor that controls the importance of each data point in the calculation. A higher value emphasizes recent data.")
source = input.source(title="Source", defval=ohlc4, group="Kernel Estimate")

// Input parameters for ATR
atrLength = input.int(title="ATR Length", defval=40, minval=1, maxval=2000, step=1, group="Channels", tooltip="The length of the Average True Range (ATR) used for both sets of channels.")
channelMultiplier1 = input.float(title="Channel Multiplier (First Set)", defval=1.5, minval=0.1, step=0.1, group="Channels", tooltip="Multiplier for the first set of channels.")
channelMultiplier2 = input.float(title="Channel Multiplier (Second Set)", defval=5, minval=0.1, step=0.1, group="Channels", tooltip="Multiplier for the second set of channels. Should be greater than the first set.")
channelMultiplier3 = input.float(title="Channel Multiplier (Third Set)", defval=6, minval=0.1, step=0.1, group="Channels", tooltip="Multiplier for the third set of channels. Should be greater than the first and second set.")
channelMultiplier4 = input.float(title="Channel Multiplier (Fourth Set)", defval=12, minval=0.1, step=0.1, group="Channels", tooltip="Multiplier for the fourth set of channels. Should be greater than the first, second, and third set.")
// End of Inputs //

// Calculations //
// Calculate the rational quadratic estimate using the imported library
rationalQuadraticEstimate = kernel.rationalQuadraticKernel(
   source,
   length,
   relativeWeight
   )

// Calculate ATR
atrValue = ta.atr(atrLength)

// Calculate the first set of upper and lower channels based on the rationalQuadraticEstimate and common ATR
upperChannel1 = rationalQuadraticEstimate + (atrValue * channelMultiplier1)
lowerChannel1 = rationalQuadraticEstimate - (atrValue * channelMultiplier1)

// Calculate the second set of upper and lower channels based on the rationalQuadraticEstimate and common ATR
upperChannel2 = rationalQuadraticEstimate + (atrValue * channelMultiplier2)
lowerChannel2 = rationalQuadraticEstimate - (atrValue * channelMultiplier2)

// Calculate the third set of upper and lower channels based on the rationalQuadraticEstimate and common ATR
upperChannel3 = rationalQuadraticEstimate + (atrValue * channelMultiplier3)
lowerChannel3 = rationalQuadraticEstimate - (atrValue * channelMultiplier3)

// Calculate the fourth set of upper and lower channels based on the rationalQuadraticEstimate and common ATR
upperChannel4 = rationalQuadraticEstimate + (atrValue * channelMultiplier4)
lowerChannel4 = rationalQuadraticEstimate - (atrValue * channelMultiplier4)

// Define the alert candle conditions
alert_buy_condition = (ta.crossover(close[1], lowerChannel4) or ta.crossover(close[1], lowerChannel3))
alert_sell_condition = (ta.crossover(close[1], upperChannel4) or ta.crossover(close[1], upperChannel3))

// Buy condition: Price to cross upwards Relational Quadratic Estimate
var buySignalAllowed = false
buy_condition = (open > rationalQuadraticEstimate and close > upperChannel1)

// Calculate the stop_buy_condition
stop_buy_condition = close > upperChannel1 and open > close[1] and not buy_condition[1]

// If buy condition and stop buy condition are met, allow buy signals
if (buy_condition and stop_buy_condition)
    buySignalAllowed := true

// Buy signal is generated if buy condition, stop buy condition, and buySignalAllowed are all true
buy_signal = buy_condition and stop_buy_condition and buySignalAllowed

// Original Sell condition: Price to cross downwards the upper channel of the third set
var sellSignalAllowed = false
sell_condition = (open < rationalQuadraticEstimate and close < lowerChannel1)

// Calculate the stop_sell_condition
stop_sell_condition = close < lowerChannel1 and open < close[1] and not sell_condition[1]

// If sell condition and stop sell condition are met, allow sell signals
if (sell_condition and stop_sell_condition)
    sellSignalAllowed := true

// Sell signal is generated if sell condition, stop sell condition, and sellSignalAllowed are all true
sell_signal = sell_condition and stop_sell_condition and sellSignalAllowed
// End of Calculations //

// Plots
// Plot the channels
plot(rationalQuadraticEstimate, color=#FF9800, title="Relational Quadratic Estimate")
plot(upperChannel1, color=color.rgb(242, 54, 69, 70), title="Upper Channel (First Set)")
plot(lowerChannel1, color=color.rgb(8, 153, 129, 70), title="Lower Channel (First Set)")
plot(upperChannel2, color=color.rgb(242, 54, 69, 70), title="Upper Channel (Second Set)")
plot(lowerChannel2, color=color.rgb(8, 153, 129, 70), title="Lower Channel (Second Set)")
plot(upperChannel3, color=color.rgb(242, 54, 69, 50), title="Upper Channel (Third Set)")
plot(lowerChannel3, color=color.rgb(8, 153, 129, 50), title="Lower Channel (Third Set)")
plot(upperChannel4, color=color.rgb(242, 54, 69, 50), title="Upper Channel (Fourth Set)", display=display.none)
plot(lowerChannel4, color=color.rgb(8, 153, 129, 50), title="Lower Channel (Fourth Set)", display=display.none)

// Plot orange dot for alert candle and green upward triangle below the candle for buy conditions with different colors
plotshape(series=alert_buy_condition ? 1 : 0, title="Alert Signal for Buy Condition", location=location.belowbar, color=color.orange, style=shape.circle, size=size.small)
plotshape(series=buy_signal ? 1 : 0, title="Buy Signal", location=location.belowbar, color=color.green, style=shape.triangleup, size=size.small)

// Plot orange dot for alert candle and red downward triangle above the candle for sell conditions with different colors
plotshape(series=alert_sell_condition ? 1 : 0, title="Alert Signal for Sell Condition", location=location.abovebar, color=color.orange, style=shape.circle, size=size.small)
plotshape(series=sell_signal ? 1 : 0, title="Sell Signal", location=location.abovebar, color=color.red, style=shape.triangledown, size=size.small)
// End of Plots //
And the library code:
Inserted Code
// @version=5
// This source code is subject to the terms of the Mozilla Public License 2.0 at https://mozilla.org/MPL/2.0/
// Thanks to jdehorty
// @description "An optimised library for non-repainting Rational Quadratic Kernel Library.
// Change log:
// 1. Removed Starting window
// 2. The size is determined based on a user-defined value, providing greater flexibility in managing the data for the bars, with the possibility of exceeding the value 2000 if necessary.
// Import the "RationalQuadraticKernelFunction" library with the option to overwrite existing variables.
library("RationalQuadraticKernelFunction", true)
// Define an exported function called "rationalQuadraticKernel" with the following parameters:
// - series float src: Input series to apply the Rational Quadratic Kernel to.
// - simple int lookback: Size of the input series to consider.
// - simple float relativeWeight: Weight used in the calculation.
export rationalQuadraticKernel(series float src, simple int lookback, simple float relativeWeight) =>
    // Initialize variables to store the weighted sum and cumulative weight.
    float currentEstimate = 0.
    float cumulativeWeight = 0.

    // Determine the size of the input series (limited by lookback or available bars).
    size = math.min(lookback, bar_index + 1)

    // Loop through the input series.
    for i = 0 to size - 1
        // Get the value at the current index from the input series.
        y = src[i]

        // Calculate the weight using the Rational Quadratic Kernel formula,
        // avoiding division by zero.
        weight = math.pow(1 + (math.pow(i, 2) / ((math.pow(lookback, 2) * 2 * relativeWeight))), -relativeWeight)

        // Accumulate the weighted sum of input values.
        currentEstimate += y * weight

        // Accumulate the weights.
        cumulativeWeight += weight

    // Prevent division by zero if cumulativeWeight is zero.
    if cumulativeWeight == 0
        // If cumulativeWeight is zero, set it to a small non-zero value.
        cumulativeWeight := 0.001

    // Calculate the final Rational Quadratic Kernel estimate by dividing the weighted sum by cumulativeWeight.
    rationalQuadraticEstimate = currentEstimate / cumulativeWeight
// Example
// @version=5
// @author vinayakavajiraya
// @description "An implementation of optimised RationalQuadraticKernelFunction as a indicator for analysis"
// indicator(title="Relational Quadratic Kernel Estimate [Vin]", shorttitle="RQKE-V", overlay=true, timeframe = "", timeframe_gaps = false)
// Import (latest) external library
// import vinayakavajiraya/RationalQuadraticKernelFunction/2 as kernel
// Input parameters for the kernel estimate
// length = input.int(title="Lookback Window", defval=10, minval=1, step=1, group="Kernel Estimate", tooltip="The number of previous bars to consider when calculating the rationalQuadraticEstimate. Higher values capture longer-term trends.")
// relativeWeight = input.float(title="Relative Weight", defval=8, minval=1, step=1, group="Kernel Estimate", tooltip="A factor that controls the importance of each data point in the calculation. A higher value emphasizes recent data.")
// source = input.source(title="Source", defval=close, group="Kernel Estimate"), // Data source (e.g., close price) for the calculation
// Calculate the rational quadratic estimate using the imported library
// rationalQuadraticEstimate = kernel.rationalQuadraticKernel(
//   source,           // Data source for calculation
//   length,           // Lookback window
//   relativeWeight    // Relative weight of data points
//   )
// Plot the rational quadratic estimate on the chart
// plot(rationalQuadraticEstimate, color=color.orange, title="Relational Quadratic Estimate")
good evening, Programmers,
Hope you guys doing well, am using one tool called keys_SynchroChart_Line which sync object and i found little problem to use and have another indicator (called it SMC draw) which draw trendline, rectangle and predefined text. when add SynchroChart it does not recognize object from another indicator firstly but when change object prefix of another indicator like to "Rectangle 1" its work and recognize all object but still not able to recognize text or label.
it's possible to fix this
**no need to change object prefix of another indicator, can recognize all object which i draw in higher time frame and can sync with lower time frame.
**most important recognize text or label