I am trading EURUSD and only EURUSD for 11 years now. The road wasn't as easy as I thought. But here I am still learning on a daily basis. I tried almost every single method available on the internet and back tested thousands of them. I tried robot trading and intense manual trading. I found that my personality is best suited to Scalping. I learned that you need a Simple System and most importantly focus on a Specific Session to bring in better performance. I learned SMC, ICT and they have made me disciplined and profitable.
Let me tell you there's no precise entry technique. Especially today I am going to write a system that requires flexibility. Before I dive into the system, you need the following:
- This system works best on PC
- you need a clear idea on Fair Value Gap and Market Session
- I don't trade New York mostly because NY is the time when news gets released making the price extremely volatile. NY session often disrespects logics and manipulates in lighting speed.
- Talking about manipulation, you also need a handsome idea on how bank and major institutions manipulate price to your disadvantage. I will discuss as much as I can.
First of All, why you need a PC? because this system heavily relies on TDI indicator, and you can't use that indicator in your mobile platform.
Secondly, Fair Value Gap. What is it? If you are new to trading, you have reason not to know what FVG is but Veterans are well aware of the concept when Price Creates Gaps. Go to minute 5 chart and look for 3 candles in a row where the high of first candle and low of 3rd candle has gap (bullish FVG). Vise versa for bearish FVG.
Thirdly, the strategy I am about to discuss works on NY sessions, but I don't recommend trading NY session. Rather it is way more predictable and profitable to trade Asian and London opens (first 3 hours).
Finally, the Manipulations, what is it? Look guys simply said Manipulation is incorporated in those regions where retail traders have their stop losses and stop orders are placed. Banks and major institutions go into those areas with a view to take out stops and activate stop orders and then reverse. This is also known as Liquidity Grab.
Now the fun part! The Strategy!!
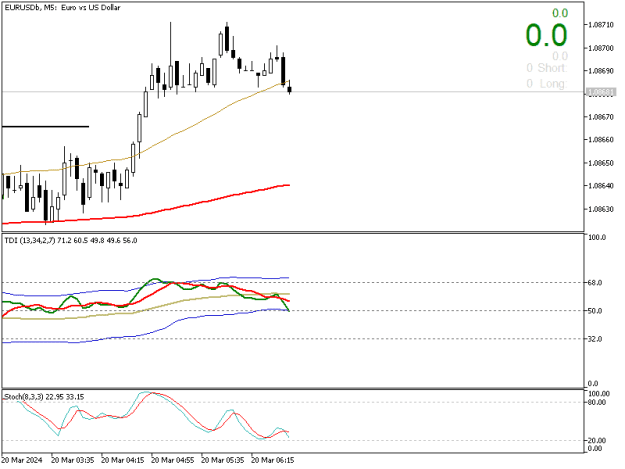
First things First, set up the indicators. Attach them to your charts!
- TDI - 13,34,2,7
- Stochastic - 8,3,3
- TEMA - 200
- EMA - 200
Now you need to focus on a particular session. I strongly encourage Asian/London Open (1st 3 hours)
Let's get into the strategy and entry module (Buy Entry Module)
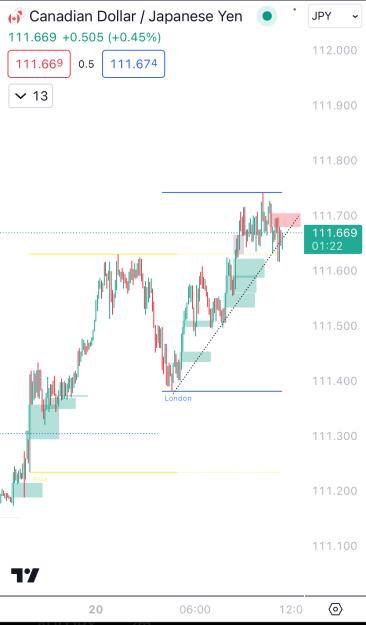
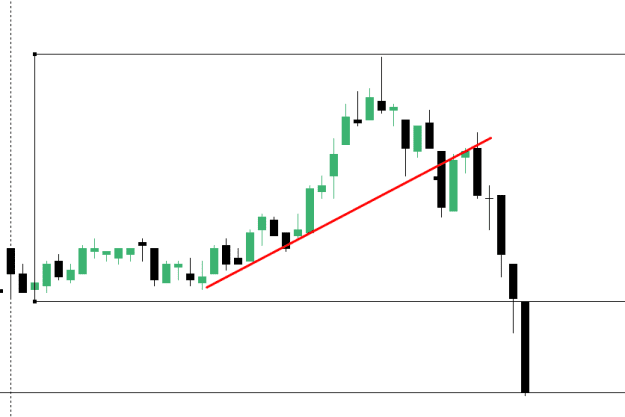
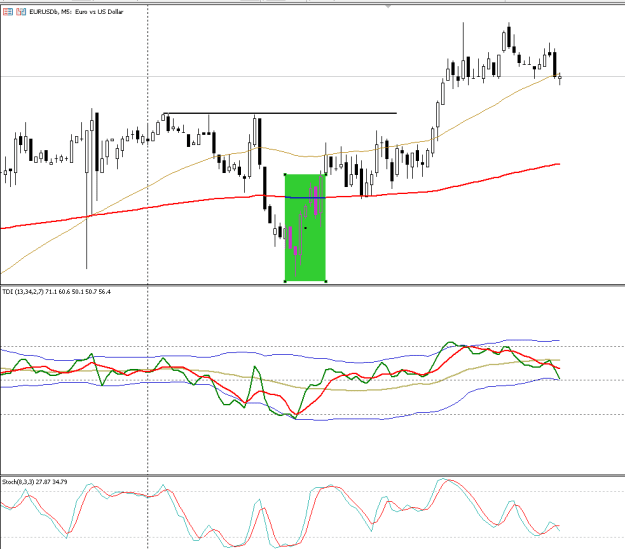
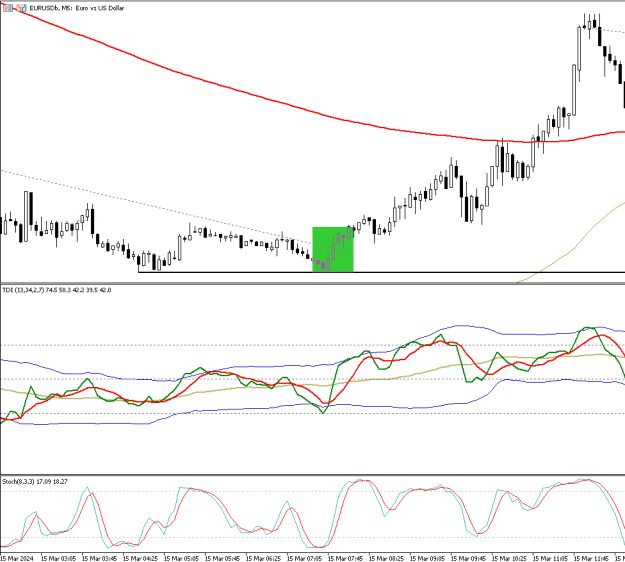
- Look you need a condition where price is in a uptrend. You can draw a line connecting the higher Lows of that uptrend.
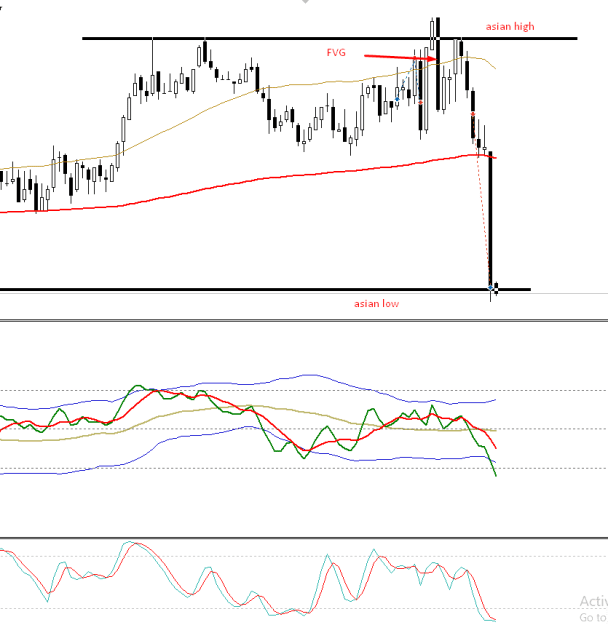
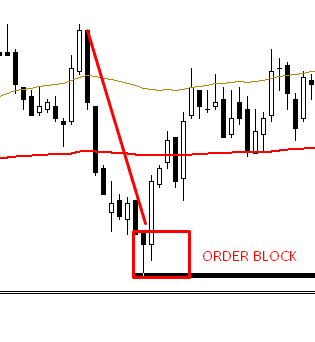
- Now let's assume London just opened, and price is on a uptrend, where is the liquidity? liquidity is either above Asian High or the above the strong resistance on your left or above the Order Block. Okay Order block is a condition where a single candle completely engulfs the previous candle and goes against the trend.
(SEE PICTURE ATTACHED)
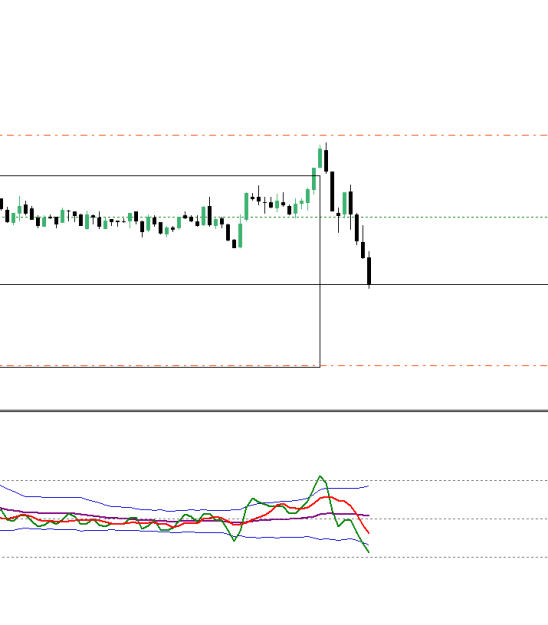
- So, you wait for the Banks to take out those liquidity and print a reversal signal.
Things get really interesting and intense at this point! You are on the lookout for opening a order but hey! slow down, you still need some confirmation!
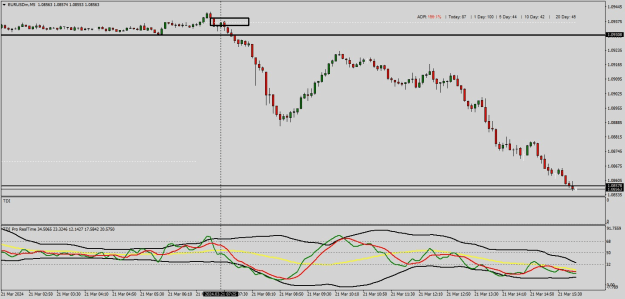
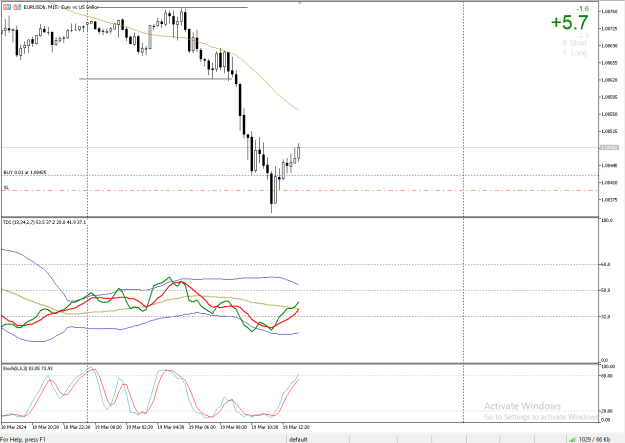
- Look at the TDI (Trader Dynamic Index) is simply a RSI plotted on a Bollinger Band. To understand the trend there is also a Moving Average in line with that RSI.
- when RSI Crosses above the moving avg line - Trend is in uptrend
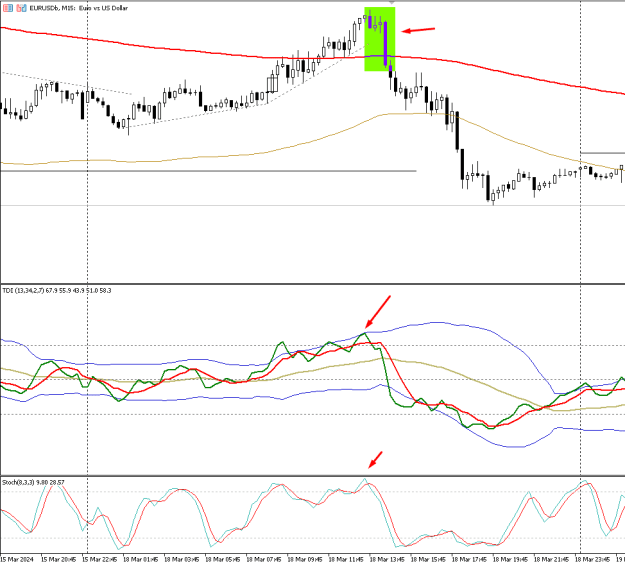
- there is a mid-Bollinger band line. if RSI is up, avg line is up and they together are above mid Bollinger band, the trend is truly going up - as you can see in the chart price is up because you can connect the supporting higher lows up that uptrend. Now you need another thing that is for the RSI line to cross above the upper line of Bollinger band. When it does so, you look for an ideal scenario to short the position.
what is the ideal scenario?
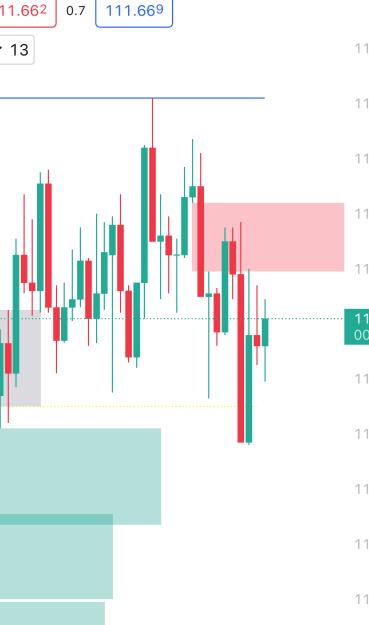
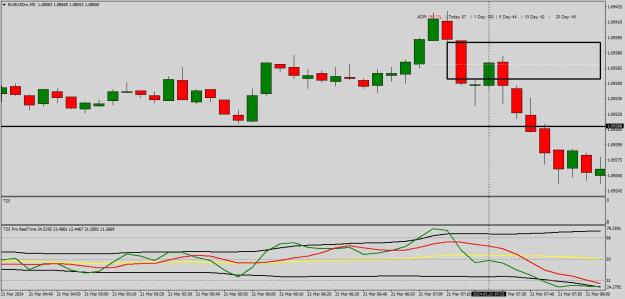
- Let's say price is now trending above upper band hence market is overbought, now you go to minute 5 and minute 15 chart and look for bearish Fair Value Gap (FVG) to form. Guys listen, Bank has taken out Liquidity + Price is oversold on TDI + now Price forming a Bearish FVG. This all indicates price reversal. There can be several ways to understand this:
1. a bearish FVG is formed + Price retraces back to that FVG and rejects
2. a bearish FVG is formed + Price don't retrace but rejection is so strong that price keep going down and down
3. Price doesn't immediately form a bearish FVG but go Berish, and bearish and then creates bearish FVG and keeps going down
This is why you need to keep an eye on both M5 and M15 and need an experienced eye set. You need plenty of practice before you can truly grasp.
Few things to consider before I attach the indicators and images:
- DO NOT trade range bound market. Specially trading mid sessions or end sessions is not allowed. This a manipulation-based reversal technique. You need the price to take out major support resistance or liquidity areas for this strategy to work and bring profitability. Don't go for trading every time RSI crosses above upper band and lower band.
- TEMA, EMA and Stochastic gives you better idea on price positioning. They don't serve any other purpose.
Okay now you need a way to profitably set Stop Loss and Take Profit. I believe once you are in profit, you better end up being profitable in that trade.
- Put your stop loss right below the candle that inaugurated that FVG, and your 1st take profit will be 1:1.
- Once your first TP is hit, Close 50% and make your stop loss Break Even.
- Your Final TP will be 1:2.
Constructive discussion is appreciated!
Happy Trading!!
Let me tell you there's no precise entry technique. Especially today I am going to write a system that requires flexibility. Before I dive into the system, you need the following:
- This system works best on PC
- you need a clear idea on Fair Value Gap and Market Session
- I don't trade New York mostly because NY is the time when news gets released making the price extremely volatile. NY session often disrespects logics and manipulates in lighting speed.
- Talking about manipulation, you also need a handsome idea on how bank and major institutions manipulate price to your disadvantage. I will discuss as much as I can.
First of All, why you need a PC? because this system heavily relies on TDI indicator, and you can't use that indicator in your mobile platform.
Secondly, Fair Value Gap. What is it? If you are new to trading, you have reason not to know what FVG is but Veterans are well aware of the concept when Price Creates Gaps. Go to minute 5 chart and look for 3 candles in a row where the high of first candle and low of 3rd candle has gap (bullish FVG). Vise versa for bearish FVG.
Thirdly, the strategy I am about to discuss works on NY sessions, but I don't recommend trading NY session. Rather it is way more predictable and profitable to trade Asian and London opens (first 3 hours).
Finally, the Manipulations, what is it? Look guys simply said Manipulation is incorporated in those regions where retail traders have their stop losses and stop orders are placed. Banks and major institutions go into those areas with a view to take out stops and activate stop orders and then reverse. This is also known as Liquidity Grab.
Now the fun part! The Strategy!!
First things First, set up the indicators. Attach them to your charts!
- TDI - 13,34,2,7
- Stochastic - 8,3,3
- TEMA - 200
- EMA - 200
Now you need to focus on a particular session. I strongly encourage Asian/London Open (1st 3 hours)
Let's get into the strategy and entry module (Buy Entry Module)
- Look you need a condition where price is in a uptrend. You can draw a line connecting the higher Lows of that uptrend.
- Now let's assume London just opened, and price is on a uptrend, where is the liquidity? liquidity is either above Asian High or the above the strong resistance on your left or above the Order Block. Okay Order block is a condition where a single candle completely engulfs the previous candle and goes against the trend.
(SEE PICTURE ATTACHED)
- So, you wait for the Banks to take out those liquidity and print a reversal signal.
Things get really interesting and intense at this point! You are on the lookout for opening a order but hey! slow down, you still need some confirmation!
- Look at the TDI (Trader Dynamic Index) is simply a RSI plotted on a Bollinger Band. To understand the trend there is also a Moving Average in line with that RSI.
- when RSI Crosses above the moving avg line - Trend is in uptrend
- there is a mid-Bollinger band line. if RSI is up, avg line is up and they together are above mid Bollinger band, the trend is truly going up - as you can see in the chart price is up because you can connect the supporting higher lows up that uptrend. Now you need another thing that is for the RSI line to cross above the upper line of Bollinger band. When it does so, you look for an ideal scenario to short the position.
what is the ideal scenario?
- Let's say price is now trending above upper band hence market is overbought, now you go to minute 5 and minute 15 chart and look for bearish Fair Value Gap (FVG) to form. Guys listen, Bank has taken out Liquidity + Price is oversold on TDI + now Price forming a Bearish FVG. This all indicates price reversal. There can be several ways to understand this:
1. a bearish FVG is formed + Price retraces back to that FVG and rejects
2. a bearish FVG is formed + Price don't retrace but rejection is so strong that price keep going down and down
3. Price doesn't immediately form a bearish FVG but go Berish, and bearish and then creates bearish FVG and keeps going down
This is why you need to keep an eye on both M5 and M15 and need an experienced eye set. You need plenty of practice before you can truly grasp.
Few things to consider before I attach the indicators and images:
- DO NOT trade range bound market. Specially trading mid sessions or end sessions is not allowed. This a manipulation-based reversal technique. You need the price to take out major support resistance or liquidity areas for this strategy to work and bring profitability. Don't go for trading every time RSI crosses above upper band and lower band.
- TEMA, EMA and Stochastic gives you better idea on price positioning. They don't serve any other purpose.
Okay now you need a way to profitably set Stop Loss and Take Profit. I believe once you are in profit, you better end up being profitable in that trade.
- Put your stop loss right below the candle that inaugurated that FVG, and your 1st take profit will be 1:1.
- Once your first TP is hit, Close 50% and make your stop loss Break Even.
- Your Final TP will be 1:2.
Constructive discussion is appreciated!
Happy Trading!!
Attached Image(s) (click to enlarge)
Attached File(s)