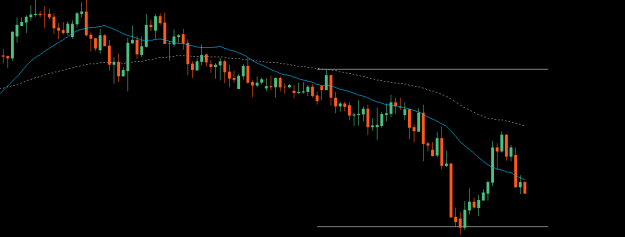
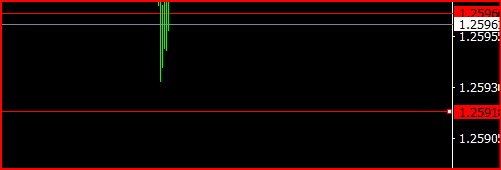
Disliked...an indicator that gives the bar a different color at the opening or another time...determine the color and of course the time...Ignored
- draws a candle at a given time once every day, hh:mm
- optional color
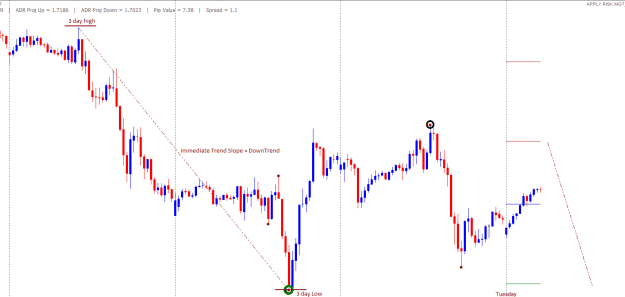
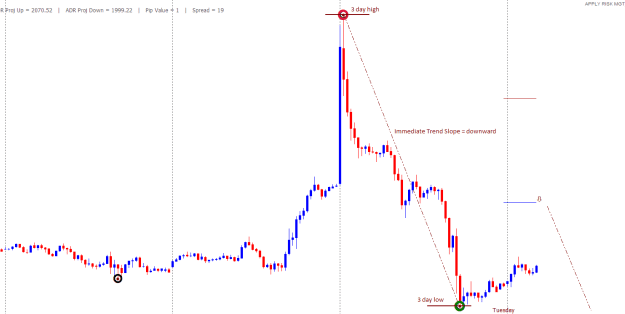
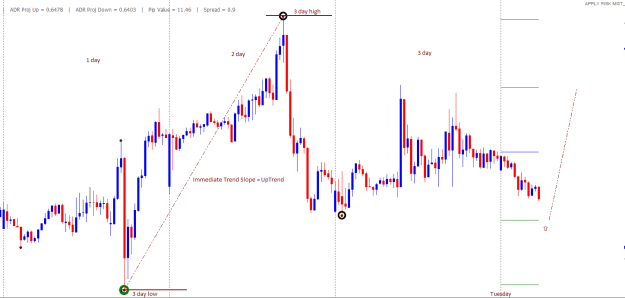
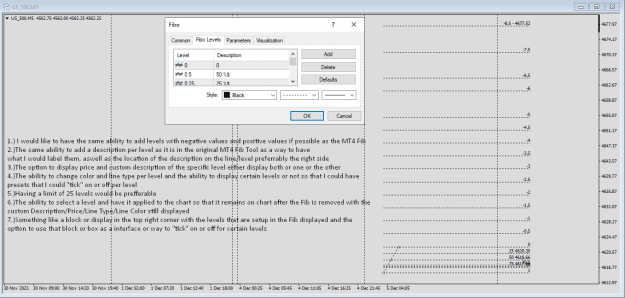
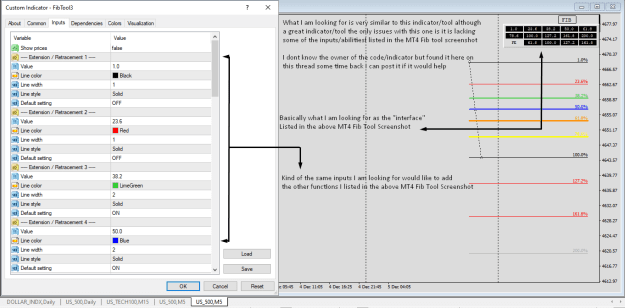
Attached Image (click to enlarge)
Attached File(s)
1