Daily / Intraday Bias Trading
This trading method / style came from observations made whilst trading the DHR Line Method.
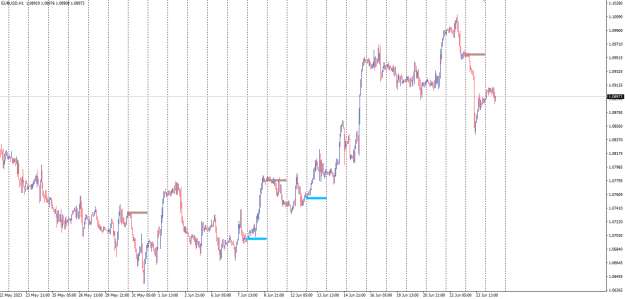
I have always had an interest in understanding how the price range expands during a single day. We know that that price movement is cyclic in nature. What if a daily picture was taken at the end of the day, of the daily expansion, a computer could probably categories the pictures and determine the daily bias at the start of the day.
This is just a concept but has led to the beginnings of a trading method / style which I use and could benefit from others input.
The idea is to identify day / intraday bias / cycle, to help trade the trend or counter trend etc…
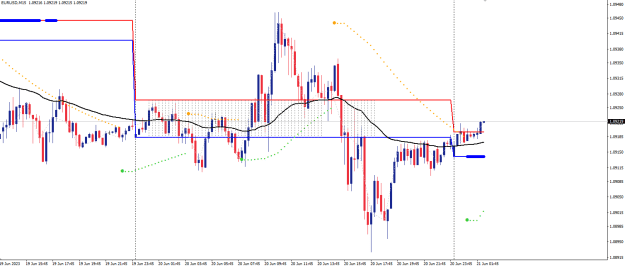
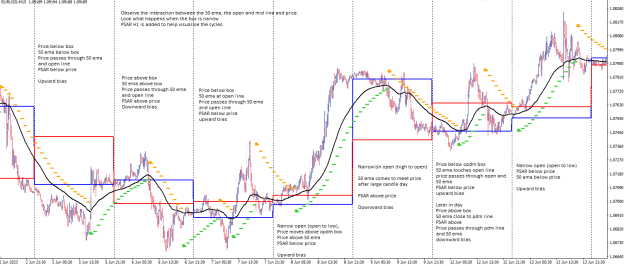
For intraday trading, in my opinion (others may disagree), the daily open price is the point of control. It is the single price from which the range of the day expands from in an asymmetrical way. Price often, but not always, zigzags above and below the open price through the day.
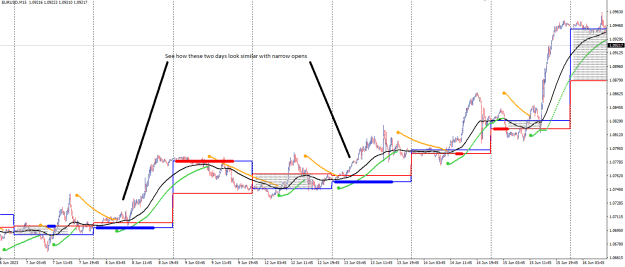
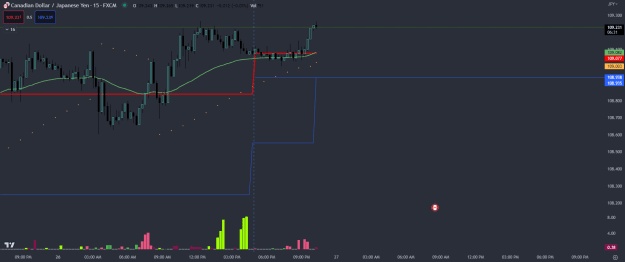
The second line utilised is the previous day mid-point (pdm) to form an D1 open to pdm (opdm) box. Observation has shown the pdm to be an important price. Put the indicator D1 Open Mid on a M15 chart and observe. See how in ~80% of the day the price moves from open and touches the pdm. See how there are also days when price is not even in the opdm box. This gives the potential to categories / provide a story to the potential direction of price travel.
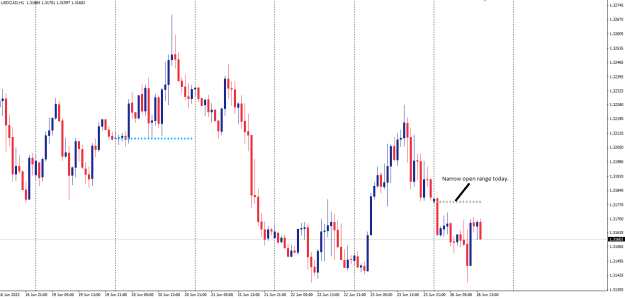
Previous day high and low are not shown on the chart as they are only used to determine if a narrow open has occurred; which can be easily seen. This is one of the categories of trade.
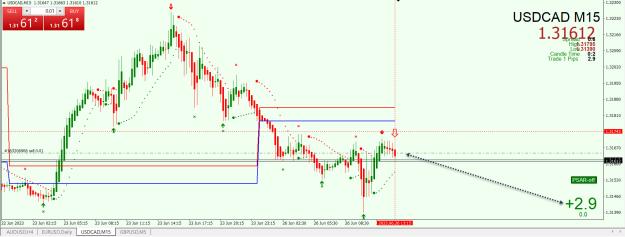
Chart:
- M15 works best
The indicators used are:
- D1 Open Mid Lines
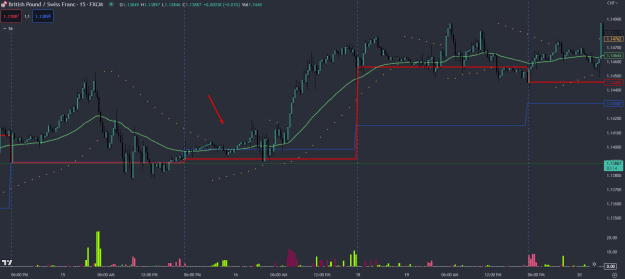
- 50 EMA, Closed price
- PSAR H1 0.05, 0.1
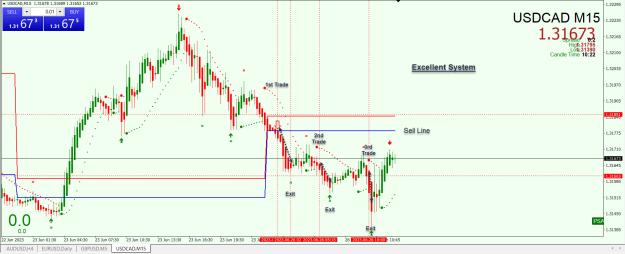
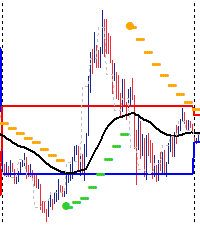
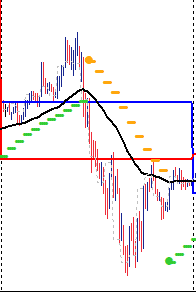
Trade based on interaction of price with 50 ema at open line or mid line as in diagram.
There are at least 6 types of trades and some catagories of trade trump other seups.
Each type of trade is potentially a trading method on it's own but are to be combined so that each day the bias is potentially known. I could be dreaming thought...
The chart explains the concept better. If there is interest it can be explained further / developed or traded as is.
Attached Image (click to enlarge)
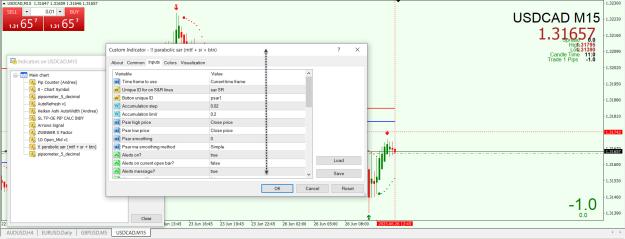
Indicators:
Attached File(s)
Attached File(s)