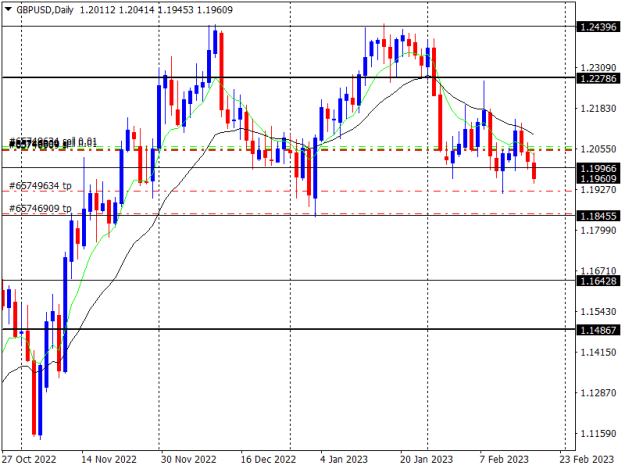
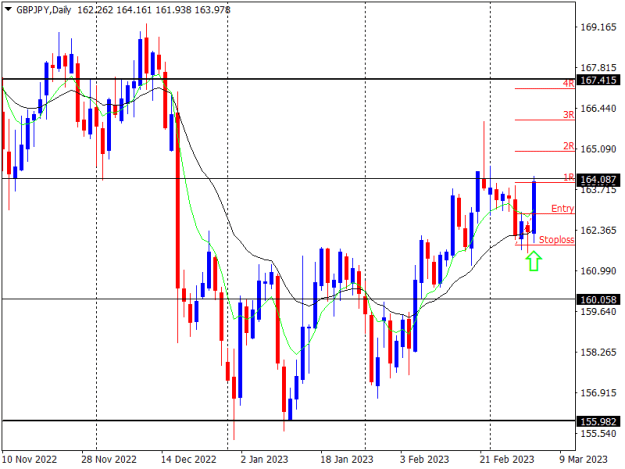
Date: 15th Feb 2023. A short order placed on GBP/USD based on the below facts:
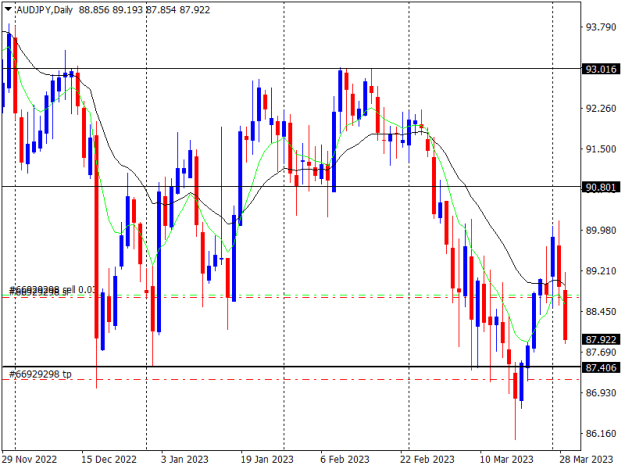
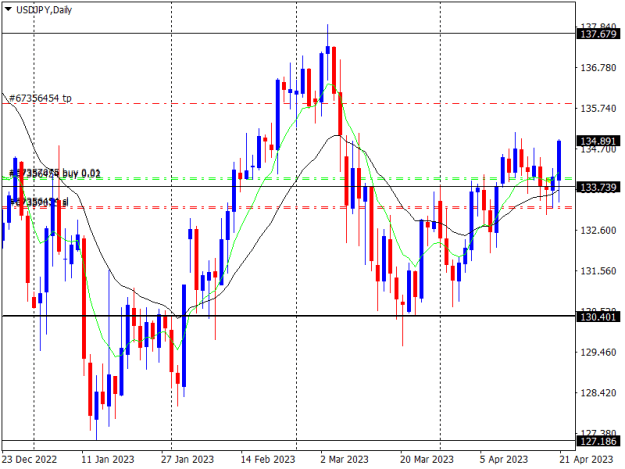
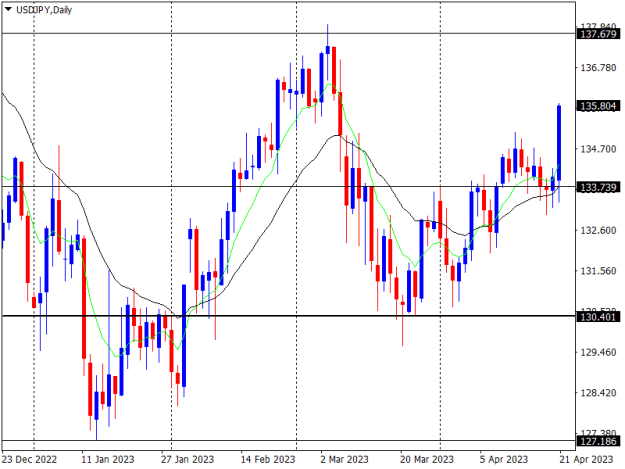
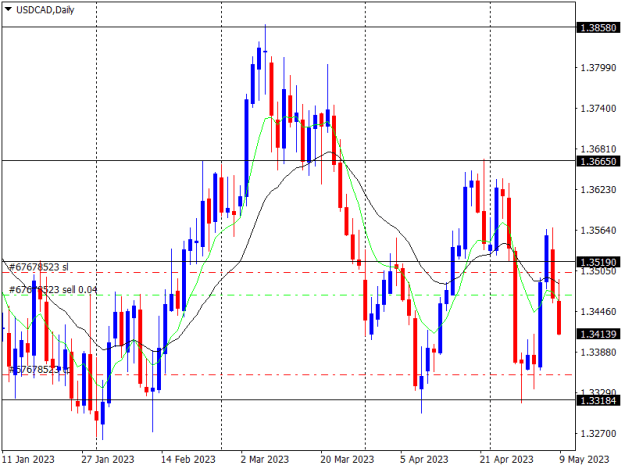
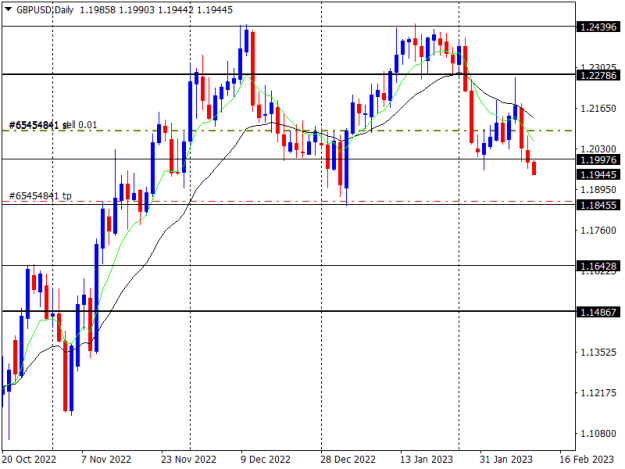
a) Trend: Bearish as the price started making LL and LH's, Price below the Daily 21-Day EMA and the 8-Day EMA had already crossed lower the 21-Day EMA and divulging showing bears had their field day!
b) Level: Price rejected the 21-Day EMA, poking through it and rejecting, also rejecting the Key Resistance at 1.2278.
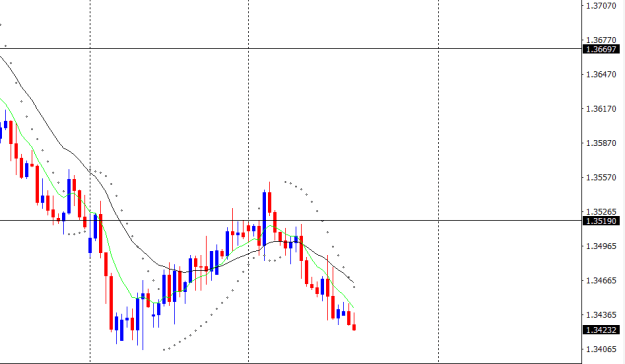
c) Signal: Bearish pin bar rejecting both the above Key resistance and the dynamic value area on the 21-Day EMA (See below chart)
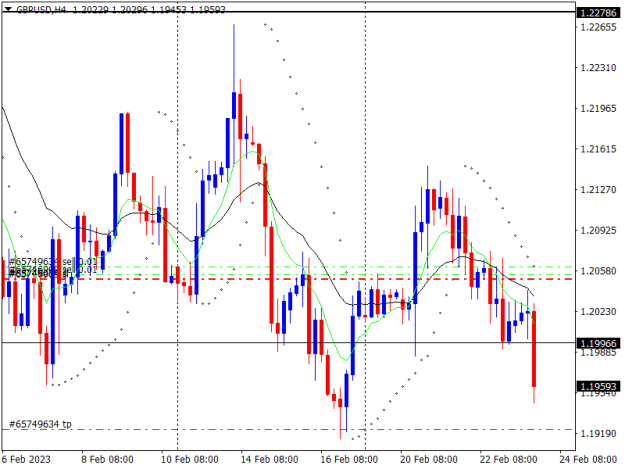
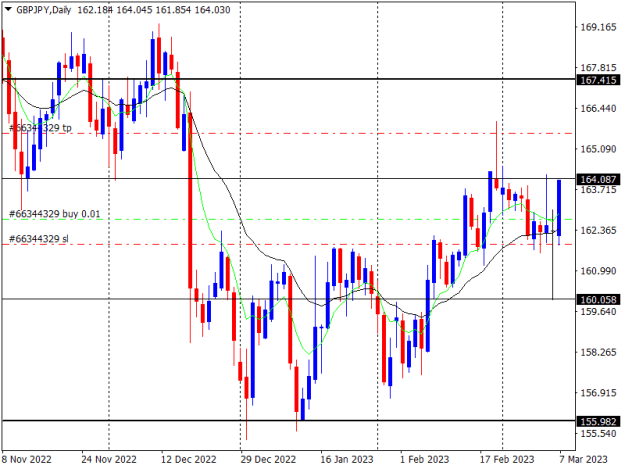
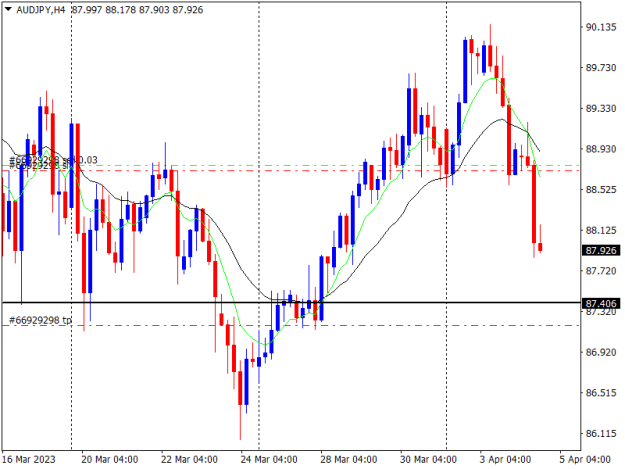
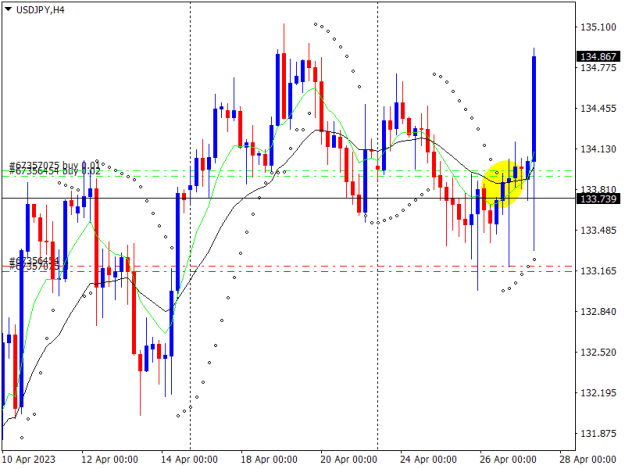
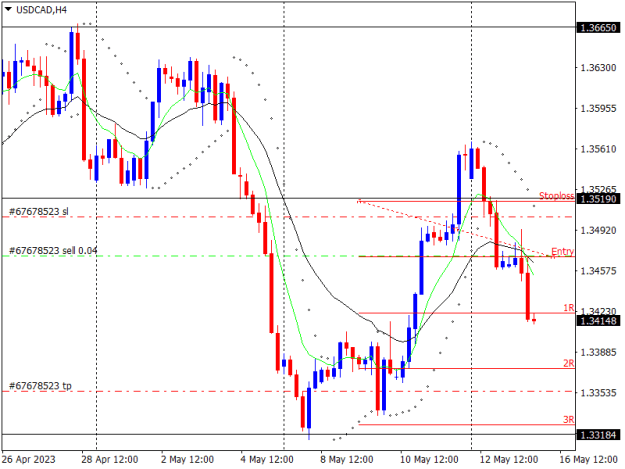
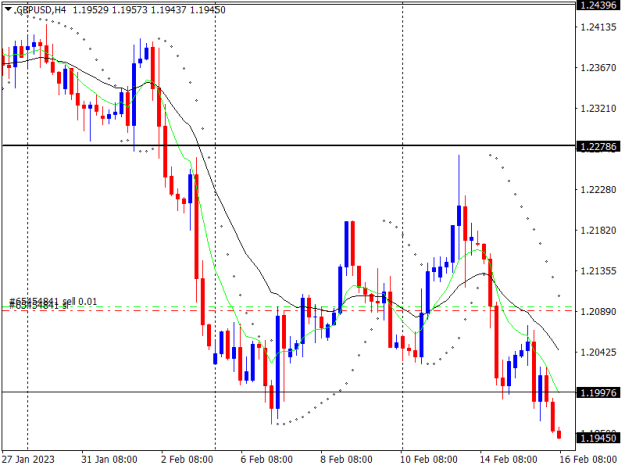
Entry: I took the entry on the 4-Hour chart after price false-broke the 21-Day EMA and closed lower triggering the short term trend on th e4-Hour chart as bearish in accordance with the bearish trend on the Daily Chart (Aligning short term trend with long term trend).
a) Trend: Bearish as the price started making LL and LH's, Price below the Daily 21-Day EMA and the 8-Day EMA had already crossed lower the 21-Day EMA and divulging showing bears had their field day!
b) Level: Price rejected the 21-Day EMA, poking through it and rejecting, also rejecting the Key Resistance at 1.2278.
c) Signal: Bearish pin bar rejecting both the above Key resistance and the dynamic value area on the 21-Day EMA (See below chart)
Entry: I took the entry on the 4-Hour chart after price false-broke the 21-Day EMA and closed lower triggering the short term trend on th e4-Hour chart as bearish in accordance with the bearish trend on the Daily Chart (Aligning short term trend with long term trend).
Attached Image (click to enlarge)
Attached Image (click to enlarge)