{quote} Yes, I found it on the daily chart. But I don't think it works well because it's not "obvious" enough. Of course, I could be wrong. I still think that the more obvious the pressure level is, the better it will work.
Ignored
Different traders can have different predictions as per their trading strategies so for me .....As I posts in my previous post that I cannot deny my trading system and so I keep myself always ready for the market gift either profit or loss.Trade safe
{quote} interesting. the level being attacked the 3rd time.
Ignored
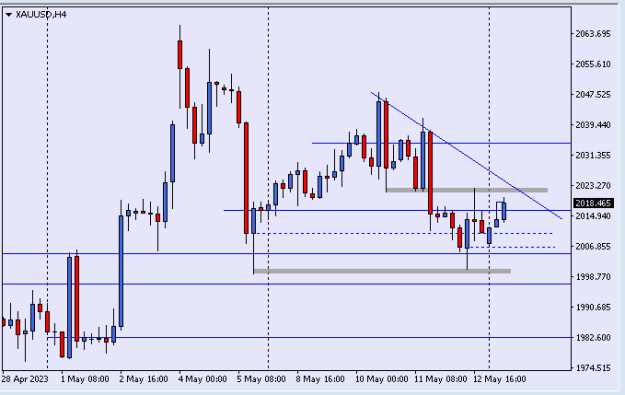
It's a imp 4H level and need brutal force to break.I think Bulls can collect more power from 2010-2012 area and then they can be successful to break it.I may be wrong.Trade safe
{quote}It's a imp 4H level and need brutal force to break.I think Bulls can collect more power from 2010-2012 area and then they can be successful to break it.I may be wrong.Trade safe
Ignored
i think the big boys never left the box. they were there all along waiting ..........
{quote} i think the big boys never left the box. they were there all along waiting ..........
Ignored
h1 can see the hh hl, as also reflected in each of the 3 h4 candles.
but not the h4 swing.
has to stay above yesterday high and trend line for some bullishness.
_____________ @ parveenverma , makin sume $$$$$$$ on xu ?
Ignored
Yes I am selling till 2010-2012 area as I mentioned earlier.I have scalp some nice short scalps. After 2010-2012 I will search for buy opportunity.Trade safe
{quote} Yes I am selling till 2010-2012 area as I mentioned earlier.I have scalp some nice short scalps. After 2010-2012 I will search for buy opportunity.Trade safe
Ignored
4H close above 2016 is a buy signal on gold. I expect that I will get chance to close my remaining 4 sell scalps because price can test 2010-2012 area before upward move.I may be wrong.Trade safe
EDIT:If I will get my 2nd level of confirmation above 2016 then I will close my short scalps those all are at BE level.and start buying up to 2031-2032 area.Trade safe
{quote} I can see your logic. That would be an institutional stop-hunting liquidity play....but I think that's being saved for another day (soon) It would appear that there's very little momentum to sell further today before market close. There are substantial buy orders waiting to be filled (I've just placed two) which will be the main focus for now.............but after that.....well then it gets really exciting. Stay tuned. There's a handful of members in this forum that appear to be well tuned in, and each with there own perspective....but generally...
Ignored
I feel the same. Will be sharing my charts soon to get feedback and get better.
{quote}4H close above 2016 is a buy signal on gold. I expect that I will get chance to close my remaining 4 sell scalps because price can test 2010-2012 area before upward move.I may be wrong.Trade safe EDIT:If I will get my 2nd level of confirmation above 2016 then I will close my short scalps those all are at BE level.and start buying up to 2031-2032 area.Trade safe
Ignored
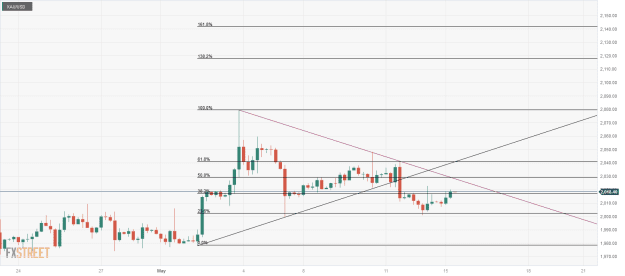
Agreed, there is clearly a double bottom waiting to be retested at 2010. From there we can expect a move closer to 2026.
Risking 25 ticks/pips, take profit 160 pips/ticks. Contact size: 1 Lot(10minis)
Stay Alive!
{quote} Agreed, there is clearly a double bottom waiting to be retested at 2010. From there we can expect a move closer to 2026.
Ignored
Actually On my chart there is a untested level @ 2011 area that need to be tested before any upward move. If price will confirm Buy entry above 2016 area then to take trade from here can be risky because price can attack anytime to test that area. So safe buy areas for me are 2011 and 2001.I am expecting slightly more up to 2032. I may be wrong.Trade safe
Here's my visual. Green horizontal is where I have my long and then red horizon signifies my take profit and that point will reassess market for next move.
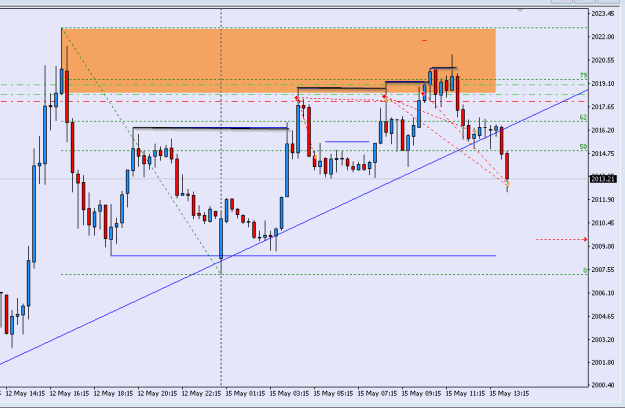
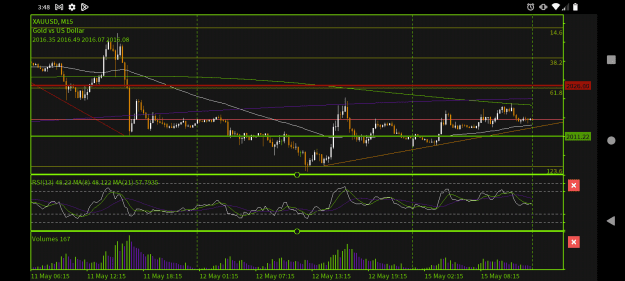
{quote} buyers trap. just story telling. don't take it seriously. {image}
Ignored
the same old story can be repeated many times.
everytime price pop its head above resistance, it got slammed down in the box.
i think big boys gone home already as price crossed border the other side of trend line.
my indicators are just lines and boxes, sometimes fib.
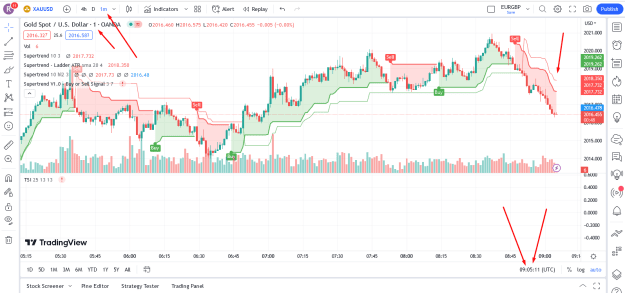
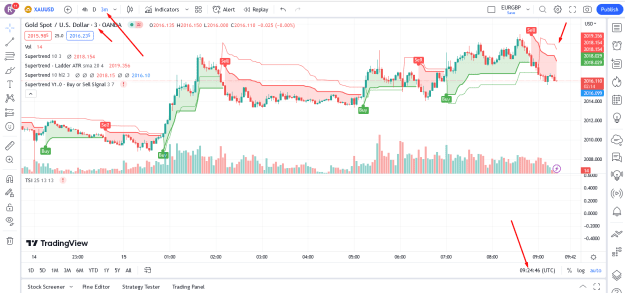
gold m15
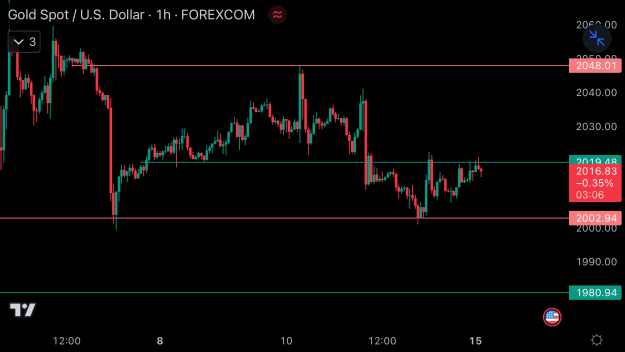
Anything is possible, never fails. With that being said, I don't appreciate how GOLD just missed our long level. I'm thinking we might have to go and visit 1998 for some real support. Just opened a short position at 2015, stop loss and take profit always on. Let's do it!
{quote}Actually On my chart there is a untested level @ 2011 area that need to be tested before any upward move. If price will confirm Buy entry above 2016 area then to take trade from here can be risky because price can attack anytime to test that area. So safe buy areas for me are 2011 and 2001.I am expecting slightly more up to 2032. I may be wrong.Trade safe
Ignored
Closed my all short scalps. Now untested area has been tested on my chart so I will now wait for possible buy opportunity.Trade safe
2010.88 Daily support on my chart and for me it is a strong support and not easy to broken down. If broken 2001 is the strongest. Trade safe