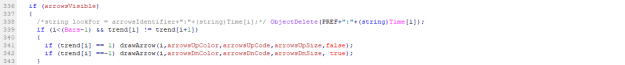
Good day everyone, Can someone please share some code on getting arrows in this code to display text instead of arrows? Would be greatly appreciated! {image}
Ignored
You can go to where drawArrow(), see how it makes arrows, make a new function similar to it like drawTextThing(), and use objectcreate(...obj_text...) and objectsetstring(...objprop_text...thetextvalue). You can highlight the inbuilt functions like objectcreate and press f1 for info on how to use it.
Hello guys, I am looking for equity manager, something like once over all equity. Please look at code attached & EA ( which currently not working ) What my aim is to monitor all open trades, once reached certain level of pips i.e 600, lock in 400pips, ( close all trade if over all pips drop back to 400 ) - if Pips increase by 1 pips, make sure increase in lock pips 400pips also increase by 1, so if total pips in profit reach at 1000, EA should protect account if pips drop back to 800pips and close all open trade. Over all it's looking on all open...
{quote} when bars changes line changes , bro {image} when indicator refresh/properties then line changes I like this indicator if problem can fixed .... btw green and red line = no problem , only for blue line (the blue line very important in this indicator)
Ignored
thanks for your efforts bro
do you mean the red and green line doesn't repaint ?
{quote}Hello Zaimur, for the lateral zone, the most important thing is that when you detect it, jump from there, with the half trend, look for the 1.02 in 1, and you have to accompany it with a channel, zigzag for the peaks, HMA to confirm the trend, I in particular, I do not use it, luck and many pips
Ignored
Thanks Mr Uru for your prompt reply. You mean Channel, which is from HalfTrend, Am I right? I had tried the HalfTrend Channel with moving average crossover leads too early entries as for bad trades in many cases. I couldn't understand the method of zigzag for the peaks. Can you Please elaborate the zigzag for the peaks. I well known about Zigzag - findings valleys and peaks. In many cases I used zigzag to finding patterns.
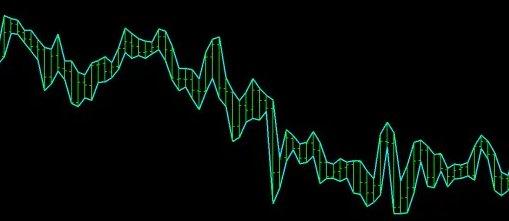
Anyone knows an indicator that runs lines connecting highs and lows of the bars like this image? {image}
Ignored
Like this?
This is a bar_chart style (not candlestick), with two SMA(1)'s added. One is based on "High" prices, the other based on "Low" prices. The upper line connects all the highs together, and similarly the lower line connects all the lows. No special indicator necessary.
[quote=Zailon;14326047]{quote} Gracias Sr. Uru por su pronta respuesta. Te refieres a Channel, que es de HalfTrend, ¿verdad? Probé el canal HalfTrend con cruce de promedio móvil que conduce a entradas demasiado tempranas en cuanto a operaciones malas en muchos casos. No pude entender el método de zigzag para los picos. ¿Puedes por favor elaborar el zigzag para los picos? Conozco bien Zigzag: encuentra valles y picos. En muchos casos utilicé el zigzag para encontrar patrones. -Zailón[/cita]
Zailon, it will depend on your strategy, I can help you with scalping in M1, it is what I operate with, in this system you cannot pigeonhole yourself, or adopt a single technique, people say that it makes a lot of noise! in GBPUSD, in this pair if you fall asleep you lost, you have to learn the closings of the markets, the technical analysis with trend lines, the news, such as today's CPI, if you get caught against the trend, how to react, the pivot points, and after all this, me! I keep making mistakes on occasion, the zigzag is one of the best indicators, but! You have to know how to use it, for the channel look for HolyChannel (200/6), you will be surprised how it works, there are a lot of indicators with buttons, and you have to find the one that suits your tastes, you can find them here in FF, and You have forexstation.com, Important do not use dll, this is another chapter, many pips
{quote} Whooo.... ¿Quién es el emocional aquí? Lo único que llamaría su atención es que su captura de pantalla es "parcial" y sin mostrar la página completa es una pérdida de tiempo discutir y/o explicar soluciones. Si (como dices) tienes los mismos botones: ¡entonces deberías poder ver la flecha! Con esa flecha puede arrastrar el '0' (última barra) a cualquier posición del gráfico. Si no ve la flecha, debe cambiar/adaptar el color de la 'cuadrícula'. Si esto no es lo que está buscando, entonces sea más específico en su solicitud. Espero que a pesar...
Ignored
Juan, it seems to me that yesterday was a very frustrating day for you! I don't know if it was due to the date (Valentine's Day), or you did wrong the orders! just relax!! The world is not ending!!, call your camel and have him bring you a good joint! You will have another point of view!! with the frustrations, the only thing you get (from experience) is gray hair!! take care and lots of pips!!
{quote} Juan, it seems to me that yesterday was a very frustrating day for you! I don't know if it was due to the date (Valentine's Day), or you did wrong the orders! just relax!! The world is not ending!!, call your camel and have him bring you a good joint! You will have another point of view!! with the frustrations, the only thing you get (from experience) is gray hair!! take care and lots of pips!!
Ignored
Haha .. what a disappointed reaction, instead of just stating if the problem is solved or not. You seems to be the one frustrated here, disturbed by some capital letters only meant to draw attention. I’ve no problem at all I'm all Relaxed and only try to help
I hope your problem is solved, as from now I will ignore any further reaction and close this subject.
No!! How are you going to solve a problem when you don't know how to interpret a graph? Your capacity is far from being able to help people, read what you wrote!!! John4y!! reflect on this!! LAUGH!! don't cry man!!
|
Joined May 2022
|
Status: Trader
|24 Posts|
Online Now
Hi guys,
Can any one look at code and make it like once you get HA signal to BUY / SELL - open position to GBPUSD, EURUSD not only chart EA on but could be use chart for just signal only and open trade on other symbols.
{quote} Like this? This is a bar_chart style (not candlestick), with two SMA(1)'s added. One is based on "High" prices, the other based on "Low" prices. The upper line connects all the highs together, and similarly the lower line connects all the lows. No special indicator necessary. {image}
{quote} Something like, untested: //time of previously completed candle long t = Time[1]; //some stuff to be used bool T_any_engulf_F_only_in_rect = true;//maybe as an input with better description //only run on a new bar if(new_bar(t)){ //check for a bullish engulfing at candle 1 if(engulf_bull_check(1)==true){ //get some price that may be used later, maybe 2 prices for a range double engulf_bull_price = High[1]; //if just an alert if(T_any_engulf_F_only_in_rect){ engulf_alert("bullish engulfing"); } //if an alert and inside some manual rect drawn...
Ignored
Thank you for this @Jeanlouie
The only obstacle I'm having now is the multi-chart issues. So the indicator is obviously attached to one chart only, lets say EURUSD and will only respond to zones drawn on that chart. How do I get it to work so that I can open other charts (lets say other 6 Major USD pairs) and draw out levels and have the indicator sync with those levels too rather than having to attach it 6 times or to each chart.
I understand I can stay on one chart and change to a different pair but sure if drawing objects works properly like this since it retains the drawings/objects on the chart, rather than the pair...plus the other pairs would be hidden so not sure if they will be picked up in the alerts.
{quote} Looks sorted out in the other thread, but some points: - error 4200, you can look up the doc for error codes to see what it is - the while loop doesn't have any condition that will stop it - the return(0) inside the while loops only occur if the trendline creation fails - return(0) also stops the whole event function of start() and doesn't proceed to the other gap check, break is more appropriate - the while loop also doesn't change any conditions, the k incrementing isn't used inside the while(..), it should be an if I would put the logic...
{quote}...multi-chart issues. So the indicator is obviously attached to one chart only, lets say... other 6...
Ignored
The information you'll need is a list of the instruments used, then the chart id's, and the names of the manually drawn rects. Assuming all charts open are desired to be checked.
Gap checking:
- keep an array of symbol names somewhere
- replace the gap checking prices with timeseries functions, eg High[i] to iHigh(symbol,tf,shift); so you can change the symbol
- loop through the symbol list checking for gaps
Rect checking:
- will need an array of chart id's somewhere
- see the docs for chartfirst() and chartnext(), save the resulting chart id's of all open charts
- can also save the chart symbols at the same time, with chartsymbol(id)
- when checking the rects are present and getting their coords, change the chart id in the object functions, eg another chart is usdjpy that has a rect, it's chart id is 12345, check a rect exists on that chart with objectfind(12345,objname) returning 0 for the main chart window and not -1 unfound, if so proceed to get coords, time1 of the upper rect on that chart would be something like long t1 = objectgetinteger(12345,objname,objprop-t1)
Putting them together, something like:
- set arrays for chart id's, and symbols
- chartnext for ids, and chartsymbol(id) to get the symbol name on that chart
- use the saved symbols to check for gaps and the saved ids to use in checking rects
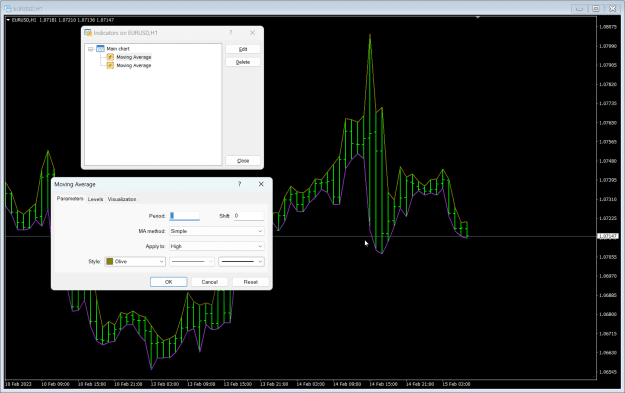
{quote}I don't have the arrow that marks it, is it the same as with the dates? It stays in the middle of the graph, enlarge it to the maximum, go back with the tabulator, and decrease the size{image}
Ignored
So you mean horizontally, the live candle is near the middle of the chart. On the toolbar, there is a button for chart shift, which puts a draggable indent on the right hand side. If the button is missing, right click on the toolbar area and go to customize, find and add the chart shift button.