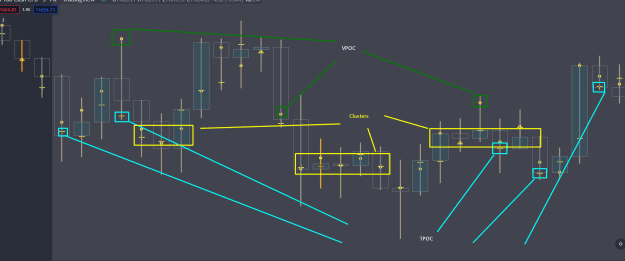
What are TPOC & VPOC?
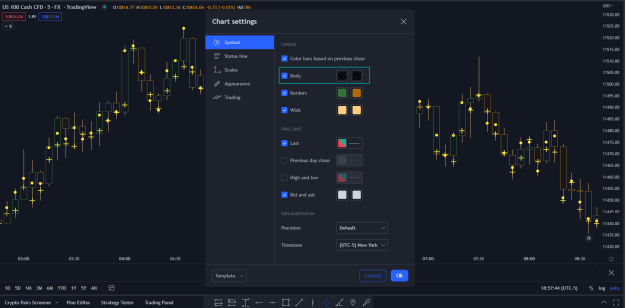
TPOC (time point of control) and VPOC ( volume (https://www.tradingview.com/scripts/volume/) point of control) are points in price where highest amount of time/ volume (https://www.tradingview.com/scripts/volume/) was traded. This is considered key information in a market profile, as it shows where market participant interest was highest. Unlike full fledged market profile that shows total time/ volume (https://www.tradingview.com/scripts/volume/) distribution, this script shows the points of control for each candle, plotted with a line (time) and a dot ( volume (https://www.tradingview.com/scripts/volume/) ). The script hides your candles/bars by default and forms a line in the middle representing candle range. In case of candles, borders will still be visible. This feature can be turned off in the settings.
Once you understand the concepts, you don't need any indicators on your chart.
How To Install: You need a free account with TradingView (http://tradingview.com)
1) 
2) 
3) 
How to utilize TPOC & VPOC
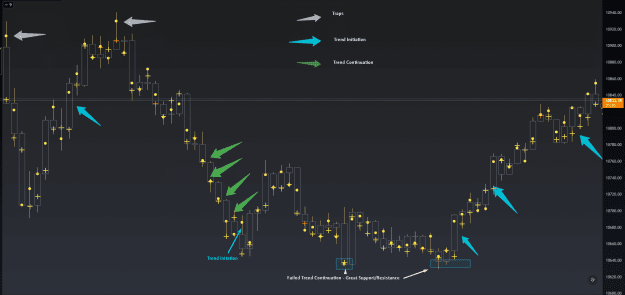
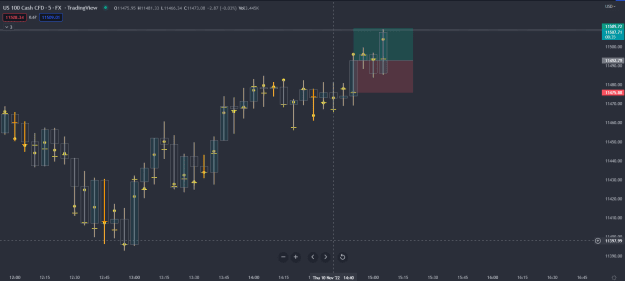
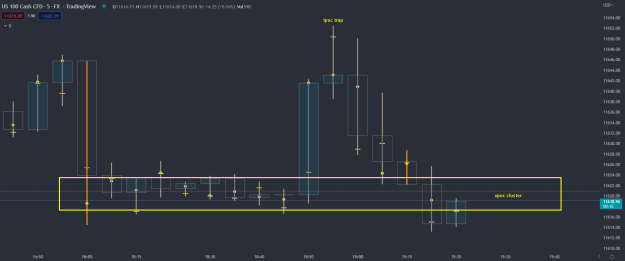
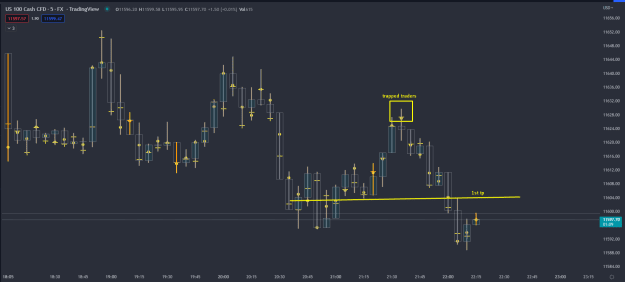
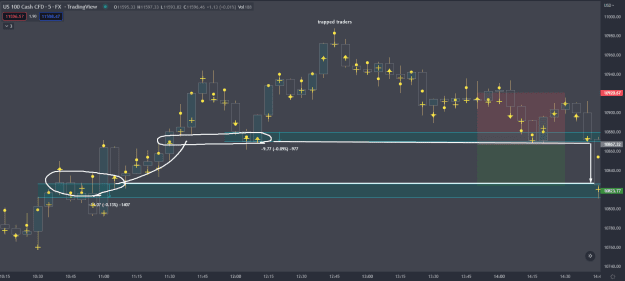
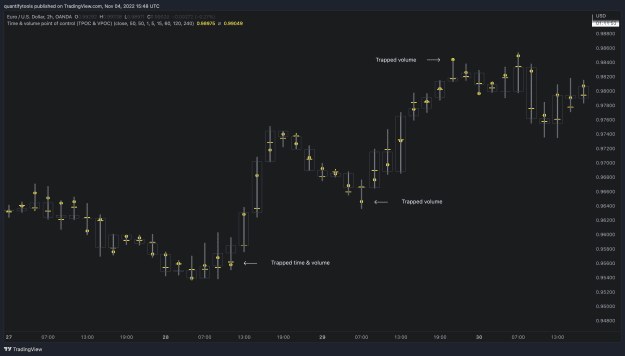
Example #1: Trapped market participants
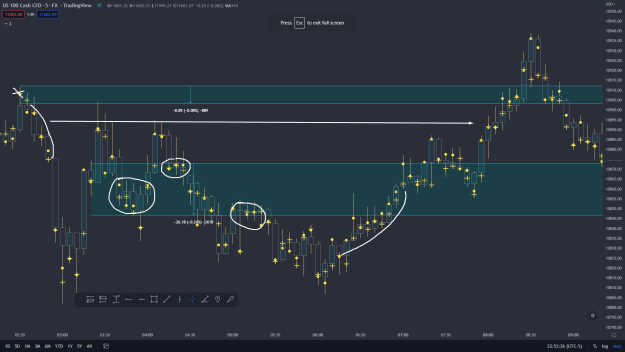
One or both points of control at one end of candle range (wick tail) and candle close at the other end serves as an indication of market participants trapped in an awkward position. When price runs away further from these trapped participants, they are eventually forced to cover and drive price even further to the opposite direction:
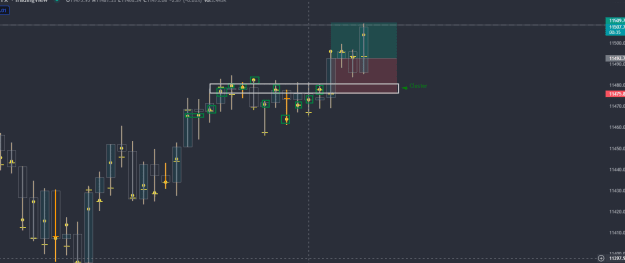
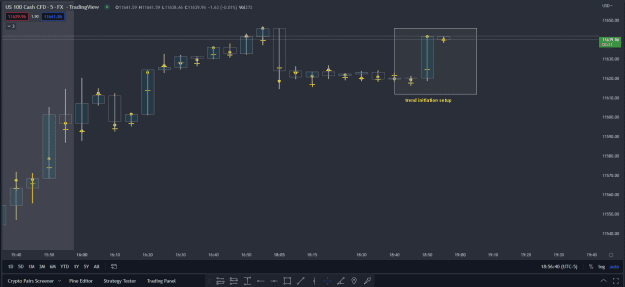
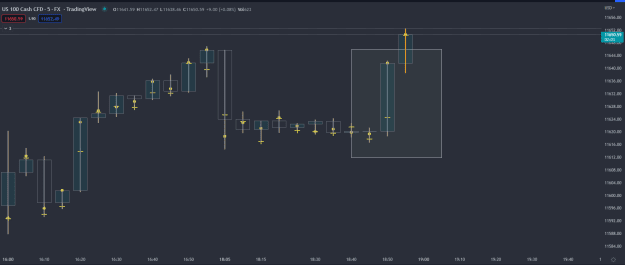
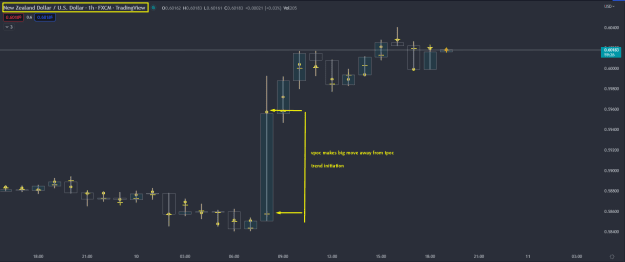
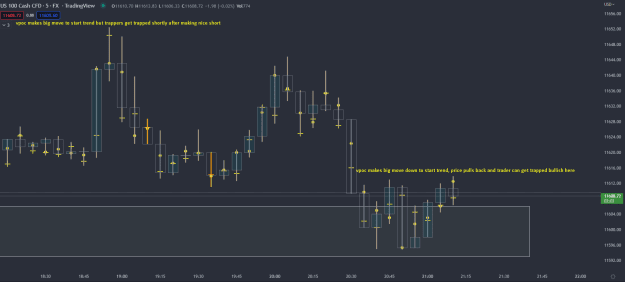
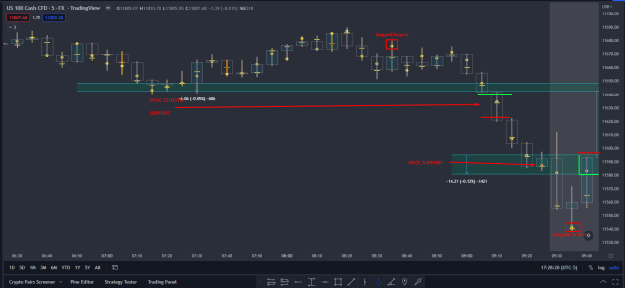
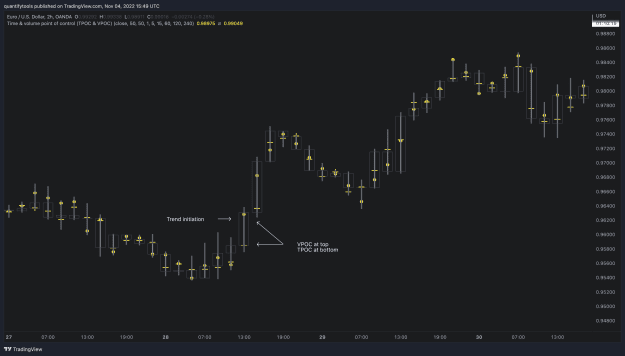
Example #2: Trend initiation
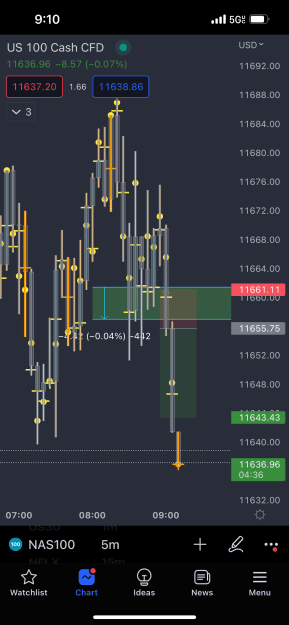
A large move that leaves TPOC behind while VPOC is supportive serves as an indication of a trend initiation. Essentially, this is one way to identify an event where price traded sideways most of the time and suddenly moved away with volume:
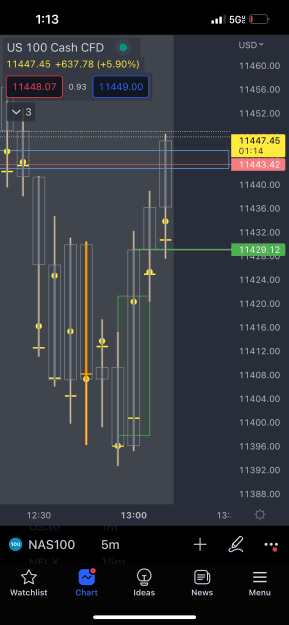
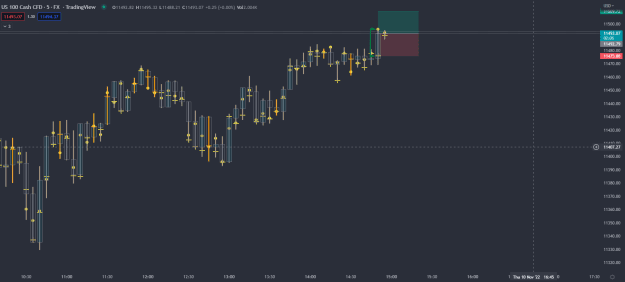
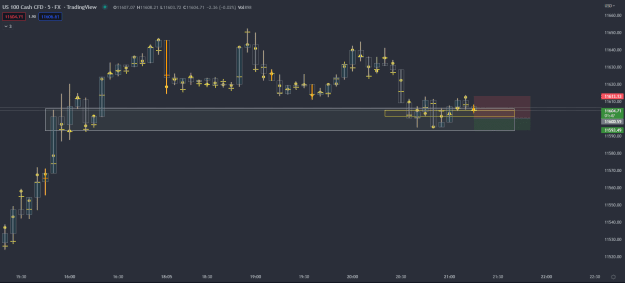
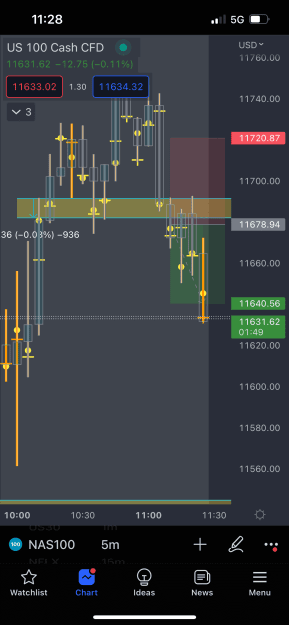
Use VPOC & TPOC To Set TP/SL
TPOC (time point of control) and VPOC ( volume (https://www.tradingview.com/scripts/volume/) point of control) are points in price where highest amount of time/ volume (https://www.tradingview.com/scripts/volume/) was traded. This is considered key information in a market profile, as it shows where market participant interest was highest. Unlike full fledged market profile that shows total time/ volume (https://www.tradingview.com/scripts/volume/) distribution, this script shows the points of control for each candle, plotted with a line (time) and a dot ( volume (https://www.tradingview.com/scripts/volume/) ). The script hides your candles/bars by default and forms a line in the middle representing candle range. In case of candles, borders will still be visible. This feature can be turned off in the settings.
Once you understand the concepts, you don't need any indicators on your chart.
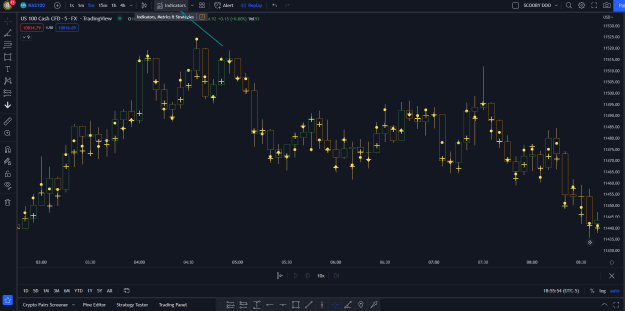
How To Install: You need a free account with TradingView (http://tradingview.com)
1)
Attached Image (click to enlarge)
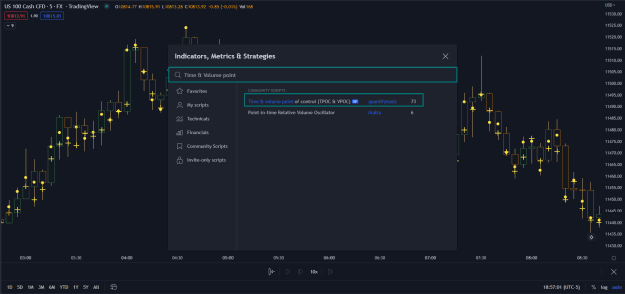
2)
Attached Image (click to enlarge)
3)
Attached Image (click to enlarge)
How to utilize TPOC & VPOC
Example #1: Trapped market participants
One or both points of control at one end of candle range (wick tail) and candle close at the other end serves as an indication of market participants trapped in an awkward position. When price runs away further from these trapped participants, they are eventually forced to cover and drive price even further to the opposite direction:
Attached Image (click to enlarge)
Example #2: Trend initiation
A large move that leaves TPOC behind while VPOC is supportive serves as an indication of a trend initiation. Essentially, this is one way to identify an event where price traded sideways most of the time and suddenly moved away with volume:
Attached Image (click to enlarge)
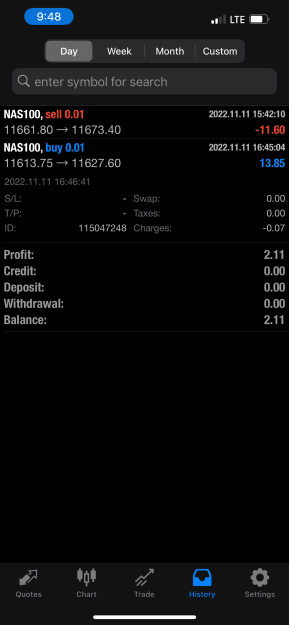
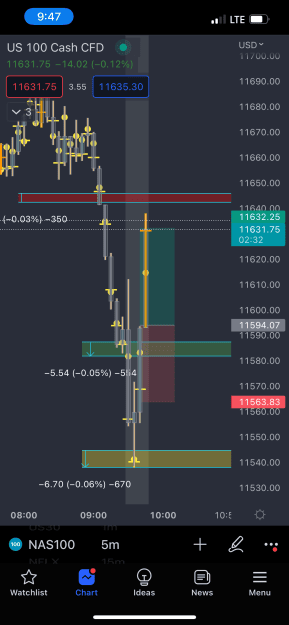
Use VPOC & TPOC To Set TP/SL