@TANKK
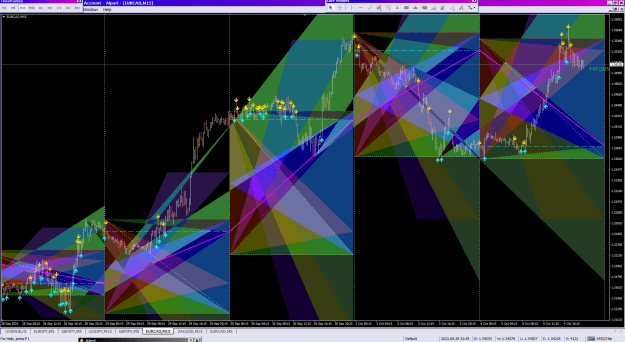
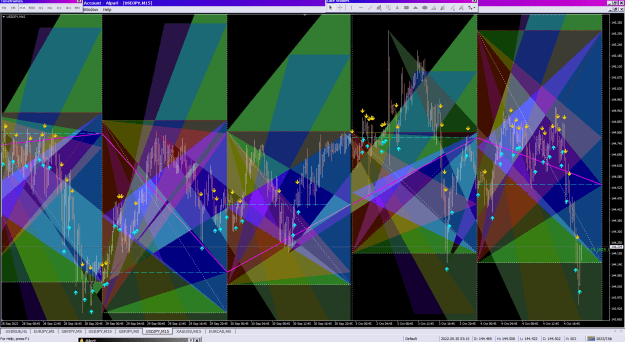
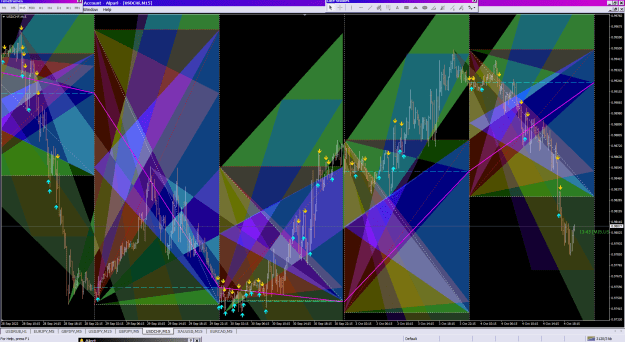
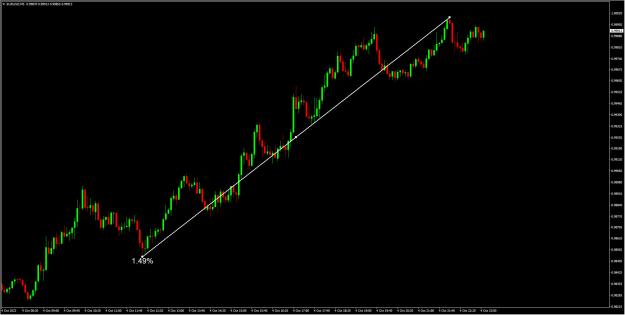
I could be wrong and bias with the triangles I want to auto construct.
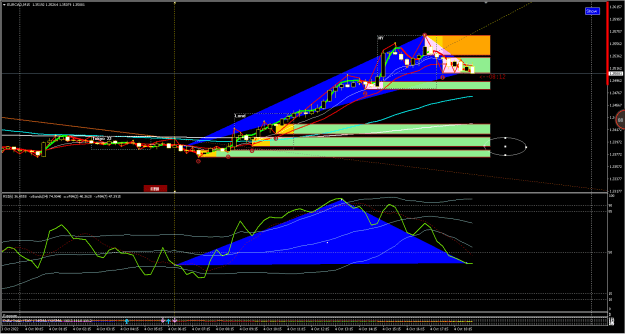
But how can anyone here explain why EURCAD is clearly in an uptrend, but RSI suffers so much and land back at same level of 6:15 the decrease started while the price still continues to grow as graph dont lie. What trick is going on? Any mathematician can explain that RSI behavior?
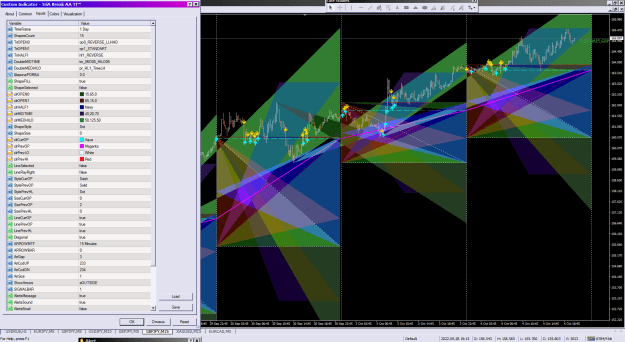
UPDT:
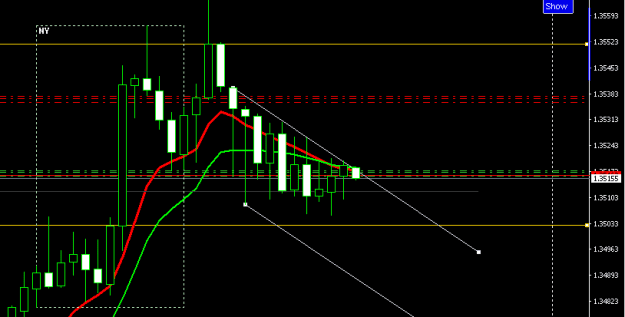
19:30 chart time 6 red large spread candle in the last 1h30, enough to tell this market is going down ?!... I have a not ggod sinking feeling when it hits 1.35
I could be wrong and bias with the triangles I want to auto construct.
But how can anyone here explain why EURCAD is clearly in an uptrend, but RSI suffers so much and land back at same level of 6:15 the decrease started while the price still continues to grow as graph dont lie. What trick is going on? Any mathematician can explain that RSI behavior?
UPDT:
19:30 chart time 6 red large spread candle in the last 1h30, enough to tell this market is going down ?!... I have a not ggod sinking feeling when it hits 1.35
Attached Image(s) (click to enlarge)