{quote} For alert, I think you have to wait for tick coming in. By the way, I think I missed something in my previous upload. Please use this updated one. {file}
Ignored
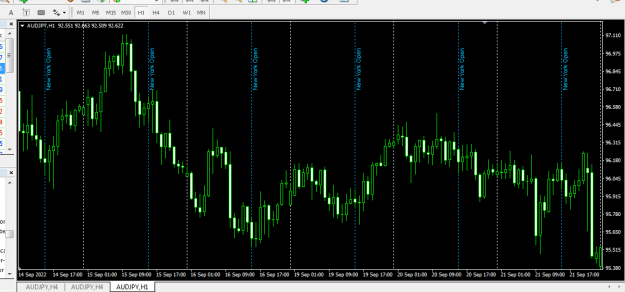
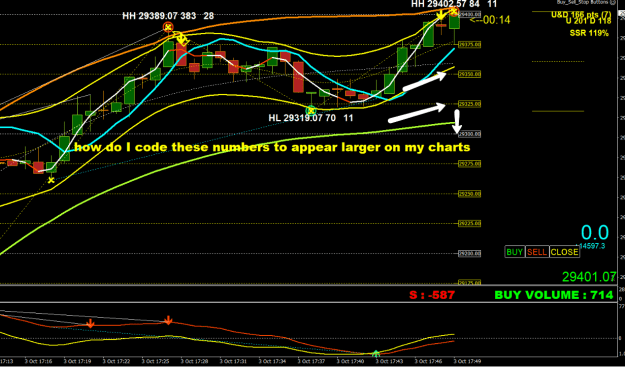
Hello BlueRain please can you help to set this vertical line based on 4hrs time frame it showed on 1hr time frame i have been fiddling with the setting but could not get the hang of it on how to display on 4hrs please kindly see what im doing wrong because input setting has 4hrs .Thanks
Does anyone have an indicator which draws a horizontal line on the close of a chosen candle? and also HIGH/LOW of the candle too (depending on whether its bull bear).
Similar to attached but needs to be full horizontal lines.
{quote} Hello BlueRain please can you help to set this vertical line based on 4hrs time frame it showed on 1hr time frame i have been fiddling with the setting but could not get the hang of it on how to display on 4hrs please kindly see what im doing wrong because input setting has 4hrs .Thanks{image}{file}
Ignored
this indicator doesn't have much of option.
I think it can be used only in 1 Hr - but you can set which line you want to display so that it can display Tokyo Open or any other from your input.
More likely, it gets hour from 1Hr chart and count how many of those are to find NY open.
Can you help convert this rectangle extender to mt5 (see code below), or if you already have it please give me the mql5 file. Thanks.
Ignored
I remade it a bit.
To delete the rectangle and the line you need to double click on one of the corners of the rectangle and wait for ticks to come in.
Otherwise, when I use the method on delete, the line is not deleted.
Dear gifted coders, could it be possible to do this in MT4 cause and effect the triangle A is caused by the signal from the lowest window, which gives us the observation triangle in RSI, which monitor the triangle in the price window. When a new signal in the lowest window appears, the painting of triangle A is completed. Depends on the arrow the observation triangle in RSI window is newly draw. As the cause in the time line does not changed when it was happened, all MTF observations of the triangle give us unique nformation on price base on the...
Ignored
Could the gifted coders, help me draw these 2 triangles: the price triangle and the RSI triangle
"how to draw the triangles in difference windows"
here is the flow diagram, for drawing triangle in RSI window and the Price window. could you tell me it is unclear for a programmer
Context
I use Price window, RSI window and Index window. The main attention is concentrated on the divergence between the price and the RSI triangle, important are the 2 lines 2nd corner to 3rd corner, or the connection line from corner1 to corner3
1/ receive a signal in the index window, draw 1st time line (dotted,brown), shout this is UP/DOWN signal to worker in price and RSI window
2/ determine corner 1 of price triangle, same time line, at the level received the signal
3/ determine corner 1 of the RSI triangle, cross of 1st time line with the RSI
4/ determine 2nd corner of the price triangle: if that is USD/X pair then 2nd corner is price higher then current price; if find then draw a hidden time line to help determine the 2nd corner of the RSI triangle
5/ determine the 2nd corner of the RSI triangle: is the cross of the timeline draw (hidden) at the 2nd corner of the price triangle; mark next price after corner1 as coner2
6/in the meanwhile mark current price as the 3rd corner of the price triangle, and share the infos that price has not find the 2nd corner in the correct level, but RSI triangle can still go on draw and connect the 1st corner to the 2nd corner that is RSI of the next price opening after receiving the signal. 3rd corner of RSI triangle is the current last point (why? so we still use the sideline of the unfinished triangle to check for divergence)
7/ determine the 3rd corner price triangle: that is the current price; connect the 1st corner to the 3rd corner
8/ determine the 3rd corner of the RSI triangle: the last point of RSI line under the current price connect the 1st corner to the 3rd corner
9/ make the computer detect the divergence1 of price and RSI, by compare the lines from corner1 to corner3 of price triangle with line from corner1 to corner3 of the RSI triangle (computer should mark the different distance corner1 to coner1 and coner3 to corner3; but if too heavy to do, we can do this step by eye, no problem)
10/ as soon as the expected price level reached mark the 2nd corner of the price window, mark also the 2nd corner of the RSI window and connect the 3 corners of price or RSI triangle
11/ When new signal appears in the index window, stop work on old triangles, start drawing new price and RSI triangle
I'm wondering if there's a way to have multiple Fibonacci Retracement Indicators in multiple MT4 charts, and for them to be permanent and don't get mixed all around the other charts?
I'm new to MT4 and I can't find this indicator anywhere, all other indicators out there are "Auto Fib" and I'm looking for an indicator that get stick to each chart for life, and to don't get mixed up between other charts. (something like OANDA Desktop Fibonacci Retracement Tool, that you set once and you forget about it because it gets stick to each chart)
{quote} DEAR TT, thanks for the mini chart,it works properly,but synch indicator is not working, i dont want the lines to be delete,i want it to appear or not appear when i click on and off on D chart.i dont want the lines to be deleted.
Ignored
Hi T4Trade this indicator create object manual not auto create object same other indicator. if you want to use button on off same you want
I don't know how to made? . You can try this . this version not deleate object but I change object color
1 hide object on other chart click button off click object you want to hide on default chart.
2 show object on other chart click button on click object you want to show on default chart.
3 if you remove indicator it will remove indicator all chart same symbol and will deleate all object all chart same symbol
I don't have time to test I test little with setting = allchart . Sorry for my English.
{quote} I remade it a bit. To delete the rectangle and the line you need to double click on one of the corners of the rectangle and wait for ticks to come in. Otherwise, when I use the method on delete, the line is not deleted. {file}
Ignored
Thank you very much for the help, I really appreciate it. Even though the indicator seems to be very buggy, but at least we have made progress, and its all thanks to you.
{quote}{quote} what bad manners did they give you open source? if you didn't rewrite these indicators from 0: so be kind to return open source! {quote} is this your indicator? why are you trying to steal it?? dirty thief... P.S. the real author of ArrZZ or "SuprRes" is russian coder Bookkeeper.. R.I.P {quote} i see, that you want to steal it, but not to modify {image} {file}
Ignored
Hi Tankk I like how you write code to help people and your straightforwardness. if you are a woman I'm going to ask you to marry me .
I'm not a code expert. I like to copy and paste. I'm embarrassed to show you my code.
and I write code for people who want to use it as they want. don't want anything else . Sorry for my English .
For deleate I copy and little adapt . and I remove indicator all same symbol with this code
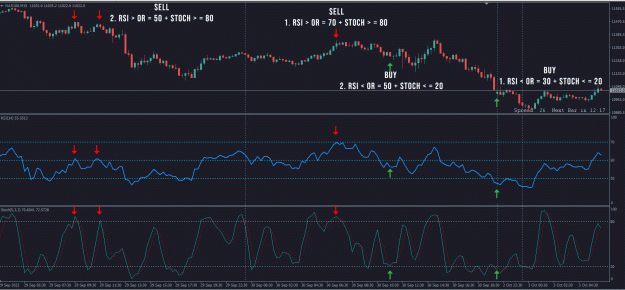
{quote} Hi tonyjustcom . I think I know why this happen . your setting custom stochastic different me . try this version you can fine setting but this version I add 2 ma for trend signal . if you don't like ma you can setting "ShowMA = false" . sorry for my English. {image} {file}
Ignored
Dear tintep!
Can you please share this indi ,script and template?
Thank you
{quote} Thank you very much for the help, I really appreciate it. Even though the indicator seems to be very buggy, but at least we have made progress, and its all thanks to you.
Ignored
I just tried the original that you posted, in MT4 and it also odesn't work properly.
The line is not deleted when the rectangle is deleted.
For the MT5 version, I suggest you always start plotting the rectangle starting from the right to the left.
This will make the experience better.
.ex4/.ex5 files can't be fixed or modified / I'm not a coder!
{quote} I just tried the original that you posted, in MT4 and it also odesn't work properly. The line is not deleted when the rectangle is deleted. For the MT5 version, I suggest you always start plotting the rectangle starting from the right to the left. This will make the experience better.
Ignored
Oh ok, well in that case, can you help remove the middle line altogether as I don't really need it and that may even help make it work better.
And if its not a bother can you make the box indicate its width in pips on the right side of the box.
Good tip about drawing it from right to left, it works better that way, thanks again.
But the bugs I was referring to in my original post is that I also noticed that when I finish drawing the box and then unselect it (double click), the box then vanishes.
{quote} Oh ok, well in that case, can you help remove the middle line altogether as I don't really need it and that may even help make it work better. And if its not a bother can you make the box indicate its width in pips on the right side of the box. Good tip about drawing it from right to left, it works better that way, thanks again. But the bugs I was referring to in my original post is that I also noticed that when I finish drawing the box and then unselect it (double click), the box then vanishes. Does it do that to you?
Ignored
Yes, I wrote about that.
Double clicking deletes the box.
I was thinking that this fact might be a problem.
Yes, I can work on it a bit more.
.ex4/.ex5 files can't be fixed or modified / I'm not a coder!
I'm not a code expert. I like to copy and paste. I'm embarrassed to show you my code. ....
Ignored
i'm not coder either
especially, you shouldn't be shamed of your codes: post it out as it is..
they will be useful for beginners & other coders.. i think, later, from few raw codes, they will be able to create "best universal code"..
one way or another, we all learn on our own & others mistakes/errors...
{quote} You are 100% right, u did mention about the deleting box. I cant believe i missed that lol. Anyways I really appreciate your assistance with this, thanks alot.
Ignored
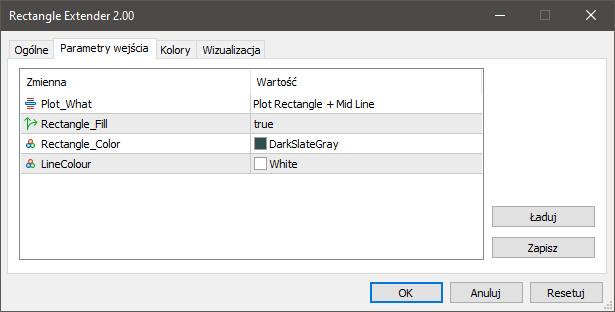
OK, I made a few changes, so this is a better version:
Attached Image (click to enlarge)
So, now you can select if you want only the Rectangle or Rectangle + Mid Line.
You can select if you want the rectangle filled, or empty.
You can select the rectangle color.
You can select the line color.
If you select only Rectangle, the line will not be plotted, and you can double click select the rectangle, and work with it.
Then, if you want to delete it, you must do it manually.
If you select Rectangle + Mid Line, the line will be plotted, and you can still double click select the rectangle, and work with it.
When the Mid Line is being plotted, you can delete the set by clicking on the line!
This gives you an interesting option, where you can select Rectangle + Mid Line, select Line_Color the same as Rectangle_Color.
This way you won't see the line, but you can still click in the middle to delete the plot.
You can plot many rectangles in this way.
The rectangle height in points is visible in the lower left corner of the rectangle.
You need to select Show object descriptions in chart properties, in order to see this.
OK, it was working, now it isn't... WTF... please wait.
{quote} OK, I made a few changes, so this is a better version: {image}So, now you can select if you want only the Rectangle or Rectangle + Mid Line. You can select if you want the rectangle filled, or empty. You can select the rectangle color. You can select the line color. If you select only Rectangle, the line will not be plotted, and you can double click select the rectangle, and work with it. Then, if you want to delete it, you must do it manually. If you select Rectangle + Mid Line, the line will be plotted, and you can still double click select...
Ignored
@BestTraderEver, wow. What you did here is simply above and beyond. I cant thank you enough. May the pips be with you!!