This is not about ATR Trailing Stop loss with fine lines drawn above and below Chart!
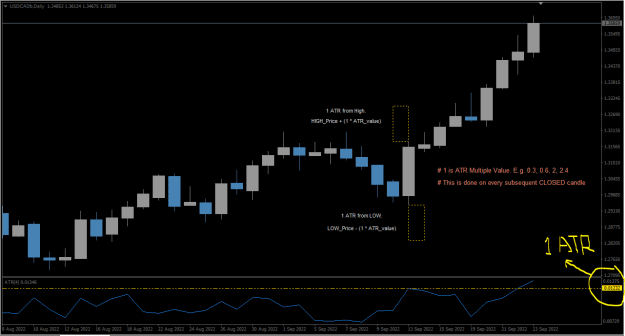
I want something that draw x_ATR_Multiple above and below a subsequent closed bar on a chart.
In this instance,
lets set x_ATR_Multiple to 1
lets set ATR_period to 4 bars/candles
a. 1 * ATR[4] ABOVE LAST closed bar/candle from the HIGH &&
b. 1 * ATR[4] BELOW LAST closed bar/candle from the LOW
Illustration:
I hope it makes sense.
Indicator must options must give ability to set both "x_ATR_Multiple" and "ATR_period".
This indicator will help you max your RRR. If someone code it, I will be obligated to explain how to use it in trading.
I currently run this calculation manually to adjust trades, it would be nice to automate the calculations and draw lines on chart at the levels.
I want something that draw x_ATR_Multiple above and below a subsequent closed bar on a chart.
In this instance,
lets set x_ATR_Multiple to 1
lets set ATR_period to 4 bars/candles
a. 1 * ATR[4] ABOVE LAST closed bar/candle from the HIGH &&
b. 1 * ATR[4] BELOW LAST closed bar/candle from the LOW
Illustration:
Attached Image (click to enlarge)
I hope it makes sense.
Indicator must options must give ability to set both "x_ATR_Multiple" and "ATR_period".
This indicator will help you max your RRR. If someone code it, I will be obligated to explain how to use it in trading.
I currently run this calculation manually to adjust trades, it would be nice to automate the calculations and draw lines on chart at the levels.