{quote} Yes, several, but keep your request short, ie what indicator and what makes an up/down arrow or what value to display in the panel.
Ignored
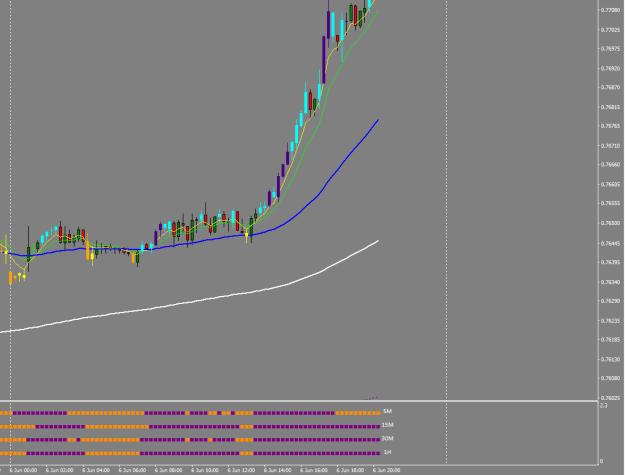
Hi JeanLouie, here is the quick and short of what I'm looking to do, is crack open this Indicator in the panel, and have it pull data from 2 different indicators across the 4 time frames above the TF I'm trading on. There are very specific data points that would make it light up, it's binary either it's there or it isn't if that makes sense, only pull the data from candle closes so that there is no repainting. I can clarify more with some screen shots of the actual indicator if it's something you're interested in? Cheers
{quote} Hi JeanLouie, here is the quick and short of what I'm looking to do, is crack open this Indicator in the panel, and have it pull data from 2 different indicators across the 4 time frames above the TF I'm trading on. There are very specific data points that would make it light up, it's binary either it's there or it isn't if that makes sense, only pull the data from candle closes so that there is no repainting. I can clarify more with some screen shots of the actual indicator if it's something you're interested in? Cheers {image}
Ignored
- what indicators?
- what buffers?
- what combination of singals gets displayed?
- if its higher tfs then the last count of candles up to the highest tf will be updated/repainted
{quote} - what indicators? - what buffers? - what combination of singals gets displayed? - if its higher tfs then the last count of candles up to the highest tf will be updated/repainted
Ignored
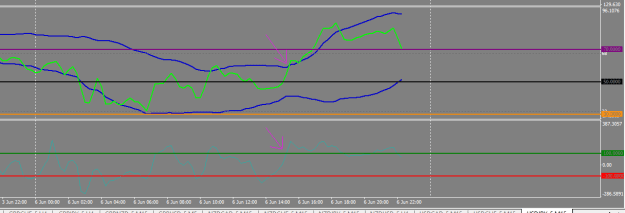
Thanks a Million, ok so essentially it would be based on the TDI RSI Line breaking the Volatility Line (Top Line for Long, Bottom Line for Short) and the CCI Going above +100 for Long and -100 for Short, those 2 events would trigger a Dot in that matrix to paint either Green for Long or Red for Short. Perhaps a Yellow would signal you to pay attention when GREEN RSI line = a Blue Volatility Band and CCI is at +/-95. I could drop a single indicator across time frames always as well, but prefer to stack them in one panel per my last example. Thoughts?
{quote} Thanks a Million, ok so essentially it would be based on the TDI RSI Line breaking the Volatility Line (Top Line for Long, Bottom Line for Short) and the CCI Going above +100 for Long and -100 for Short, those 2 events would trigger a Dot in that matrix to paint either Green for Long or Red for Short. Perhaps a Yellow would signal you to pay attention when GREEN RSI line = a Blue Volatility Band and CCI is at +/-95. I could drop a single indicator across time frames always as well, but prefer to stack them in one panel per my last example....
I found a very decent indicator without repaints, help me make an adviser on it, on a 1-minute timeframe, with changes in stop losses, profits and lots!!! !!! I think for a competent specialist to spit it out !!! I would be very grateful))) Here is the indicator itself
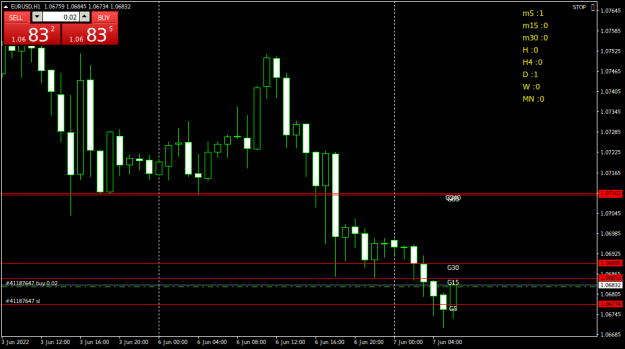
Trades are made by pending orders of the limit, take-profit and stop-loss types.
Three moving averages with different periods are used as a technical indicator.
By default 5, 14 and 17. Smoothing method: averaged (Smoothed).
The MA parameter for calculation is taken: the average price ( high + low / 2). The shift is not applied.
By default, the pair is USD|JPY, and T-frame is 15 min.
Limits are set at the level of the medium and slow MA for buying, if MAs are located up in order (for sale - if they are down in order) and between each MA value is greater than/equal to N points. N default is 2.
Each period of time limiters move to the levels corresponding to the values of the slow and medium MA.
Default T.P. = 190p, s.l. = 130p.
When conditions arise for placing limits in the opposite direction, t-profits on open positions change to the value of the average MA (where an order is also placed to enter the market in the opposite direction).
Further, the algorithm is repeated ... i.e. ALL limits (including take profits) move every time period.
Two buys must alternate with two sells and vice versa.
Hello,
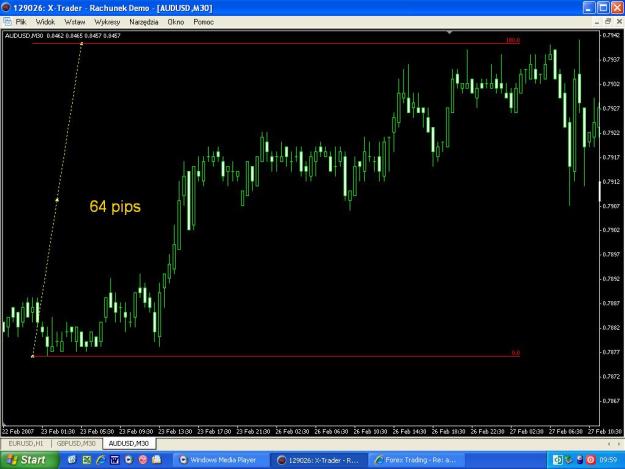
Please I want someone to recode this indicator because it's broken it should give the result as the photo.
It calculate the range from point X to point Z For example.
and another wish if the recoding could contain the sum of the volume between the 2 points it will be great
Hello, Please I want someone to recode this indicator because it's broken it should give the result as the photo. It calculate the range from point X to point Z For example. and another wish if the recoding could contain the sum of the volume between the 2 points it will be great {image} {file}
Ignored
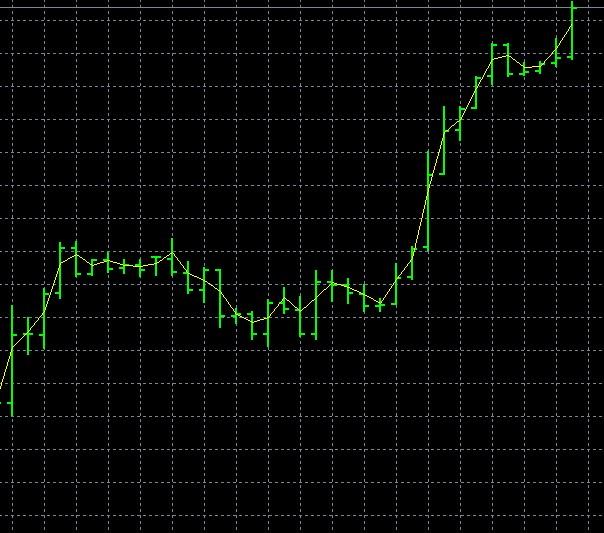
Attached indicator has no code related to what you have described.
Once fixed compile errors, it just shows lines.
{quote} Attached indicator has no code related to what you have described. Once fixed compile errors, it just shows lines. {file} {image}
Ignored
Thank you for your reply.
So please can you code what I mentioned..
calculate the range and the volume from point X to another point either higher or lower ??
This seems to be making a profit: TECHNICAL DESCRIPTION FOR THE EXPERT Trades are made by pending orders of the limit, take-profit and stop-loss types. Three moving averages with different periods are used as a technical indicator. By default 5, 14 and 17. Smoothing method: averaged (Smoothed). The MA parameter for calculation is taken: the average price ( high + low / 2). The shift is not applied. By default, the pair is USD|JPY, and T-frame is 15 min. Limits are set at the level of the medium and slow MA for buying, if MAs are located up in order...
{quote} Thanks a Million, ok so essentially it would be based on the TDI RSI Line breaking the Volatility Line (Top Line for Long, Bottom Line for Short) and the CCI Going above +100 for Long and -100 for Short, those 2 events would trigger a Dot in that matrix to paint either Green for Long or Red for Short. Perhaps a Yellow would signal you to pay attention when GREEN RSI line = a Blue Volatility Band and CCI is at +/-95. I could drop a single indicator across time frames always as well, but prefer to stack them in one panel per my last example....
Ignored
So tdi rsi line above/below the tdi bands and cci above/below 100, post the tdi indicator you have, theres heaps or versions floating around.
Dear Great Coders, I am seeking your valuable help to design Grid Trade Multiplier Tool. Grid Trade Multiplier Tool (GTMT) is not an EA but a tool which automatically place the orders based on certain Risk and Reward Control commands. The strategy is whenever the price action touches the grid point upper or lower grid level a new order creates while close and cash-out the existing positive orders. Basically it works in three directions and can be successfully used for any direction with proper Risk Management Control.{image} In the above diagrame,...
Ignored
Hello budy, how are you? Did you succeed in designing the Grid Trade Multiplier tool?
{quote} I can confirm the push messages, many thanks for this. Is it possible for the notification to bear the indicator information, such as " ZZ Wave Alert LVL 2 low" & "ZZ Wave Alerts LVL 2 high"?
{quote} Thank you for your reply. So please can you code what I mentioned.. calculate the range and the volume from point X to another point either higher or lower ??
Ignored
Fixing and writing a new indicator is not same.
I am not able to help out this.
Plus, you get same information using MT4 built-in tool ( Hair Cross Tool ) - if you click one and click on other - it gives how many bars and you total range
{quote} Hello again Eess; Thank you for your valuable insight & recommendations once again. You can be certain that I will factor all the information & guidance you kindly provided once I create the thread. I have opened a pilot live account subsequent to receiving your previous feedback & have created a trade explorer for it. Due to me still not having ironed all the bugs with this “strategy” I will fund it with around USD 200 for now & scale the account should it gain traction & prove to be something more than a me merely feeding a confirmation...
Ignored
Don't worry too much about TE, the amount also doesn't matter too, most important the rules of the system need to be craft out clearly so that people can follow, if people can follow the rules of your system, they can very well test on demo themselves to find out for themselves the profitability of it and that's what most people will do. When they test it out themselves and think it is profitable, those who can code will naturally think of how to make the process easier to get the signals/notifications etc or how to execute it more easily. Those who can trade well could also provide valuable insights to you on how to improve your system further. That's the advantage of having a thread for it, you do want to be careful of how to craft your system rules well enough so that the admin of forex factory will not move the thread to "Trading Journals". Threads under "Trading Systems" and "Trading Discussion" seems to attract more attention from traders IMO.
{quote} only one thing remains to make it more useful " could you help read forexlive rss in mt4 chart https://www.forexlive.com/rss/ [ the all one] i need the title only without link or description this way whenever any forex calendar news or any fundamental news comes out, i get to read it on chart itself. events like this one are not reported in FF calendar https://imgur.com/lsFG201.png " this way i can read forexlive headlines right on my chart as they are updated
Ignored
guys vote for this post, if you also want it on your charts for faster news reading from any site including reuters