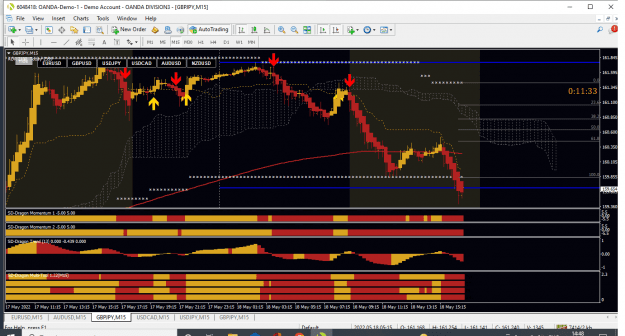
Could someone please add an option for max history bars to this TMA coral indicator, it freezes my pc because it loads in all the bars in the chart and my computer is a bit trashy
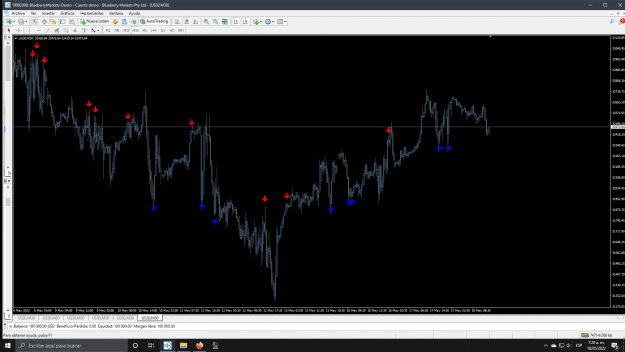
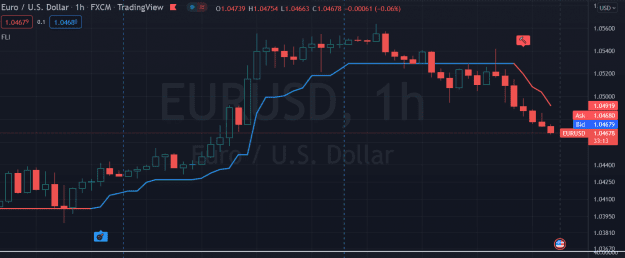
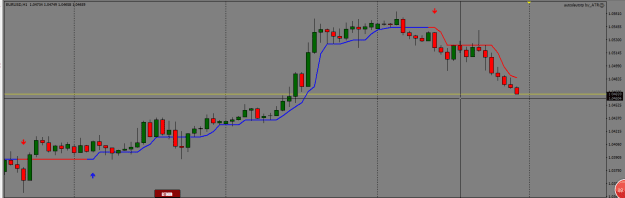
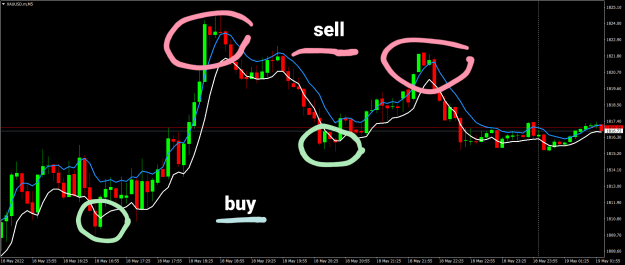
Attached Image (click to enlarge)
Attached File(s)