My method is not sophisticated. I use a few standard indicators with no customization. I have a few iron-clad rules and I follow them without fail. With this method, I do not trade everyday (I have others for intraday trading) but the method I will describe is what I used to build an incredible business and it is still my priority method for creating the majority of my income. I call it "Trend Cycle Entry".
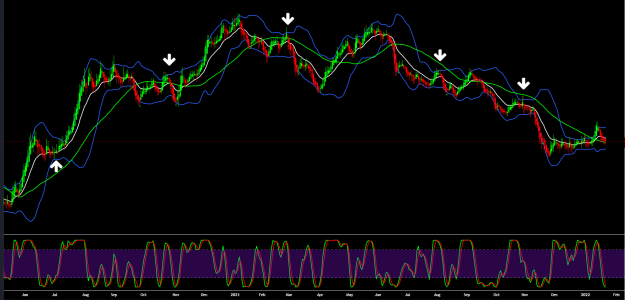
The below chart is a Daily.
Indicators:
- Heikin Ashi Candles
- 15 period EMA (White)
- 50 period SMA (Green)
- Bollinger Bands - 20/2 (Blue)
- StochasticRSI - Stochastic=10, K=3, D=3, RSI=13 (Lower Pane)
The trade is to wait until the 15 EMA crosses the 50 SMA. Once this happens, you are waiting for a reverse cycle (a retrace) in which the candles move to the opposite Bollinger Band and then disconnect from it. The 15 EMA needs to retain separation from the 50 SMA. The StochasticRSI also needs to be the opposite cycle of the preceding price action (above/below 80/20) - again, first cycle in unison with the price action. The trigger candle is the one that changes color from those of the retrace upon its close. The entry is on the open of the following candle.
Rules:
- Only the first cycle after the cross is executed - 2nd and 3rd cycles are more risky
- Price must intersect the BB
- Price must disengage from the BB
- Separation maintained by 15 EMA and 50 SMA
- Candles must change from green to red / red to green
- StochasticRSI must be in its first cycle above or below 80/20 OR crossing 80/20 in support of the trade direction.
The trade furthest to the Left (White arrow) on the chart is an example of a long trade entry:
- 15 EMA crossed up over 50 SMA
- Price retraced and intersected the BB
- Price disengaged the BB
- That candle remained green. The next candle closed red
- Stochastic RSI below 20% and rising
- Good MA separation
I entered at the open of the candle following the closed red candle. I ran a trailing stop that I tightened as the trade progressed. Closed for 528 pips. The other arrows are shorts.
I couple of the example trades occurred on the 2nd cycle of the StochasticRSI. This goes against the "first cycle" rule and is a slightly riskier trade. But I shown them as examples anyway.
I'm not in this forum every day but I will answer questions as they arise, when I am here. I do not have MT4 files for this. I use Trading View. I also use these standard indicators because, believe it or not, standard indicators are what most institutional professionals use. The simpler, the better. I don't use stops other than a trailing stop once the trade is in profit.
This method can be used on smaller timeframes. It becomes even more important to follow the rules, respect higher timeframe trends, and expect smaller runs that need to be managed more closely.
Enjoy!