Tools Used:
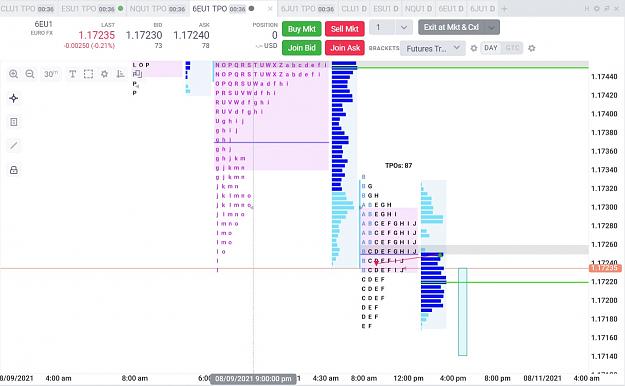
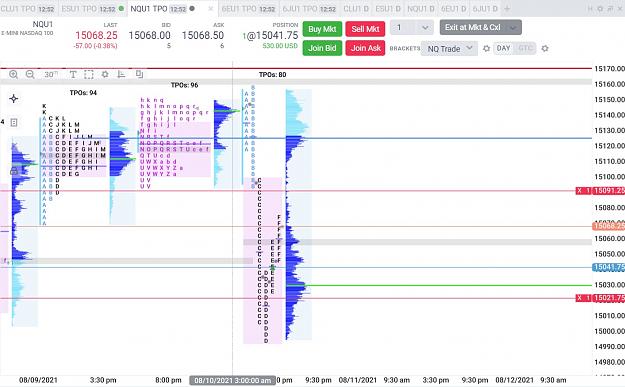
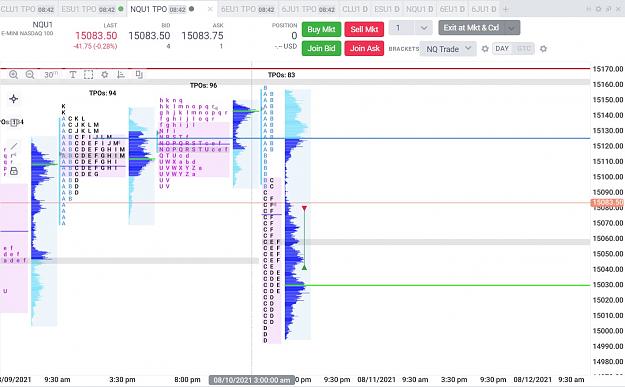
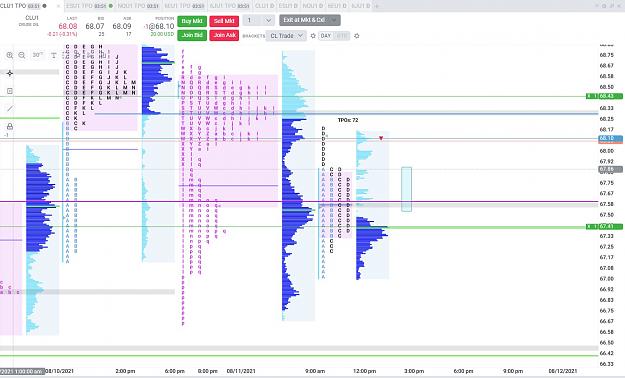
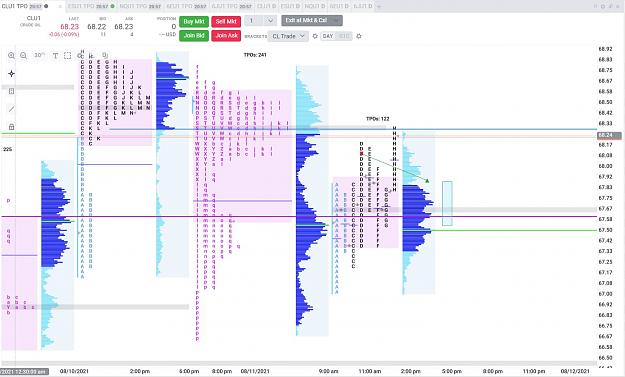
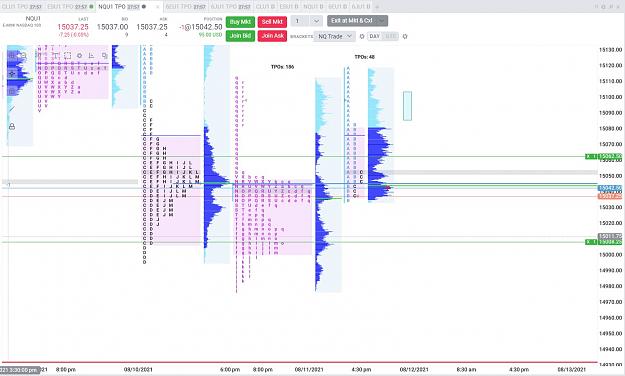
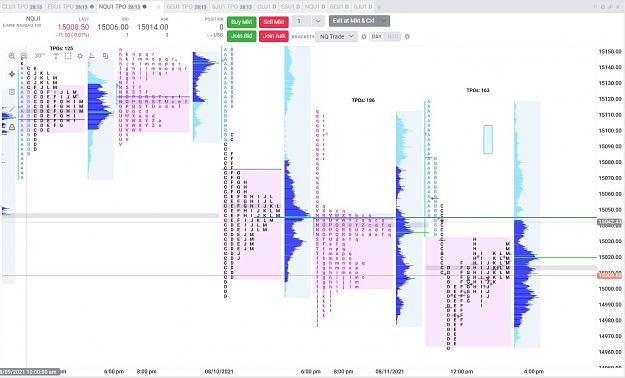
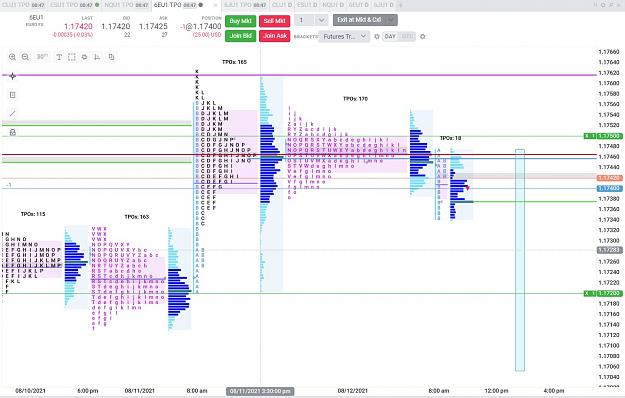
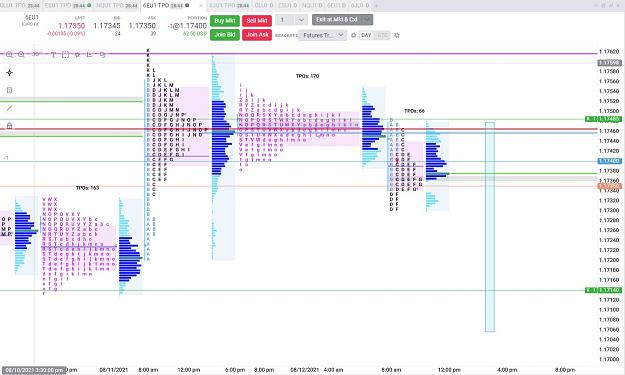
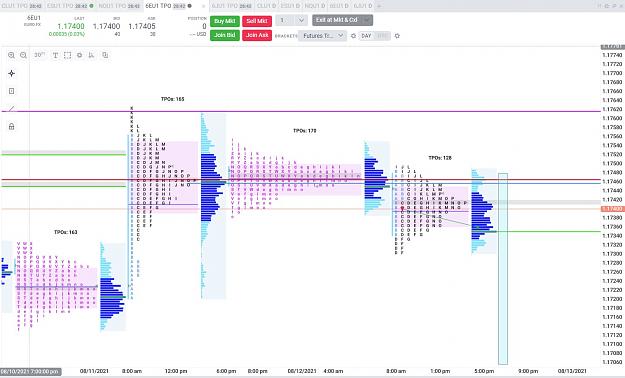
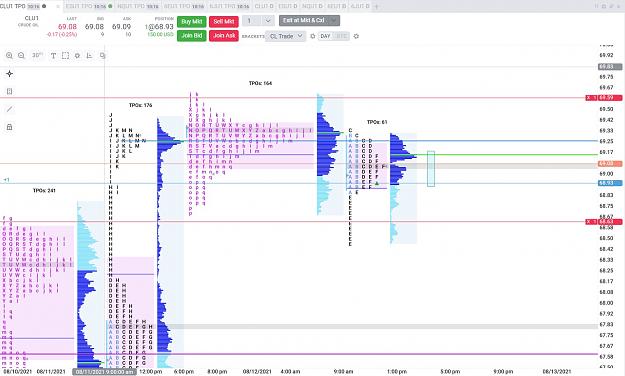
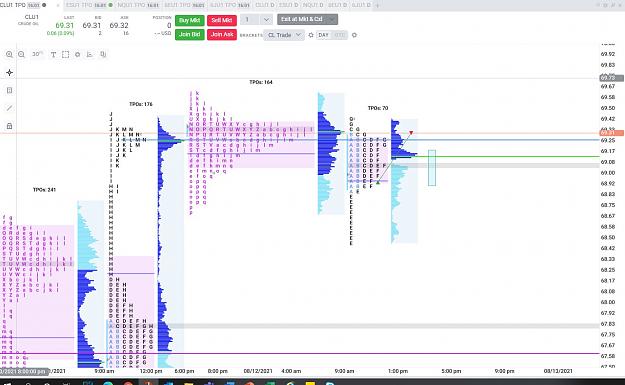
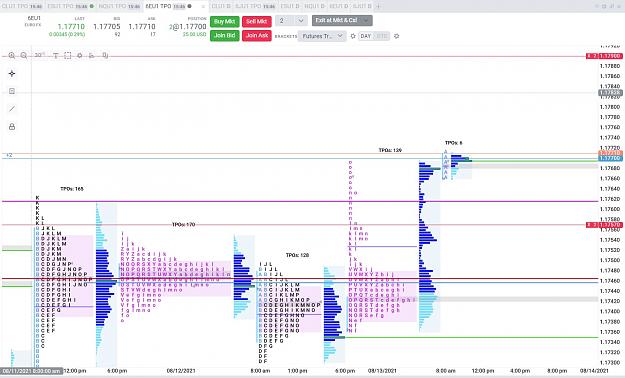
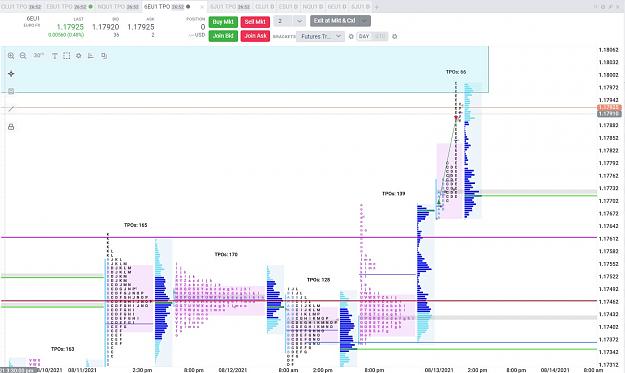
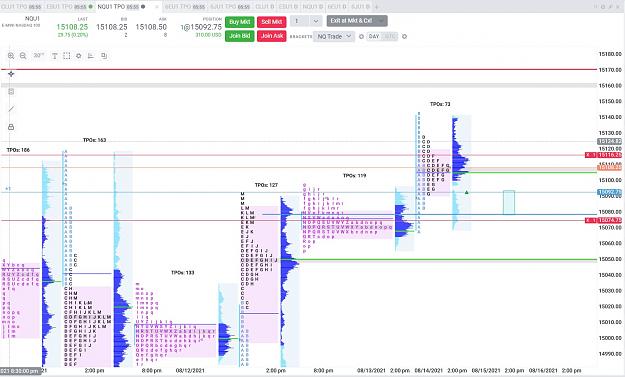
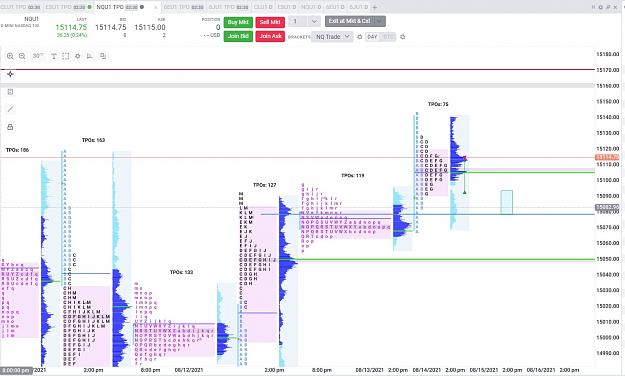
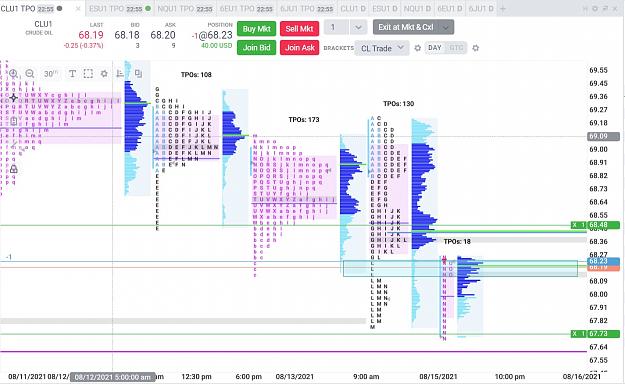
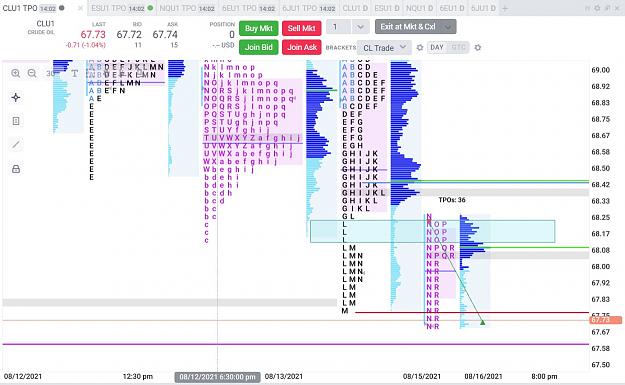
1. TPO (Time, Price, Opportunity) Chart or commonly referred to as Market Profile
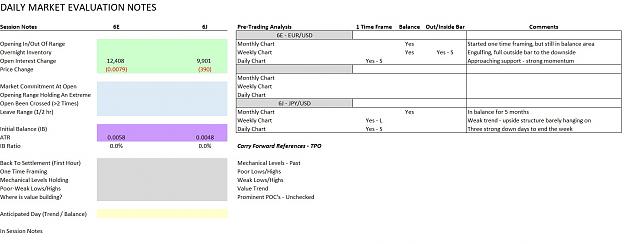
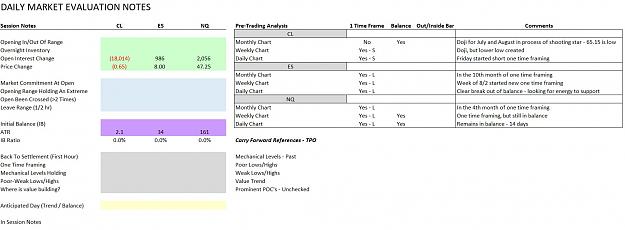
Purpose: Market profile provides an overall market view with key levels such as overnight high/low, yesterdays range high/low, POC (points of control) and a general sense of the day type which is setting up as the session progresses
2. Structure chart
Purpose: Identifies the structural expectation of highs and lows as the market auctions through the day
3. Footprint chart
Purpose: Provides the interaction between buyers and sellers. An evaluation of delta (bid ask) and cumulative delta is used. The footprint delta bar is used for entries.
4. No indicators except ATR, key reference lines, rectangles and fibs
---------------------------------------------------------------------------------------------------------------------------------------------------------------------------------
Market: Futures – Equity Index Futures (ES, NQ, YM, RTY), FX Futures (6E - EUR/USD, 6J - JPY/USD)
Regular Trading Hours (Cash Market): 9:30 - 16:00 EST (All), 20:00 - 22:00 EST (6J)
---------------------------------------------------------------------------------------------------------------------------------------------------------------------------------
Common Terms Used in the Journal
Balance = A market state where neither buyers nor sellers have control and price rotates within a defined trading range
Continuous Two-Way Auction Process = All financial markets facilitate trade (or doing business) through an auction process of bids and offers to buy or sell a financial instrument.
Cumulative Delta = The sum of all the individual bar delta's throughout a trading session or day
Delta (Bar) = Difference between buyers and sellers who place market orders (hit the bid or offer) within a candlestick or rotation
Excess = Marks the end of an upside or downside auction with a buying or selling tail of single TPO prints.
Initial Balance = An initial trading range in US trading markets which is in 60 minutes in length. This is at the discretion of the trader based on the market.
Mechanical Levels = Specific levels on a chart which shorter-term, under leveraged traders look for entries and targets.
One Time Framing = Trading periods that are making continuous highs or lows.
Open Interest = The total number of futures contracts held by market participants at the end of the trading day. It is used as an indicator to determine market sentiment and the strength behind price trends. Unlike the total issued shares of a company, which typically remain constant, the number of outstanding futures contracts varies from day to day.
Opening Range = The first 1-minute trading range
Other Timeframe Participants = Larger, institutional participants in the market.
Overnight Inventory = From the overnight session, it is the price movement from the settlement (or closing) price of the financial instrument. If the price was above the settlement price, the inventory is considered long and vice versa for short.
POC (point of control) = Highest number of TPO's printed at a single price level and represents the fairest price of the day (or where the most business was transacted)
Poor/Weak Lows & Highs = From the TPO chart, these are the highs and lows which occur in two different periods which are even (poor) or 1 TPO different (weak).
Short Term Traders = Shorter-term (daytime) traders who are generally undercapitalized and exit positions by end of day.
Single Prints = This is a single row to TPO's which are printed and separate two distribution areas
Settlement = CME end of day closing price for the RTH
Spikes = End-of-day price movements, which create an obvious spike and signal an incomplete auction.
Value & Value Area = Is approximately 70% of the TPO's traded in a trading day
--------------------------------------------------------------------------------------------------------------------------------------------------------------------------------------------------------------------------------
1. TPO (Time, Price, Opportunity) Chart or commonly referred to as Market Profile
Purpose: Market profile provides an overall market view with key levels such as overnight high/low, yesterdays range high/low, POC (points of control) and a general sense of the day type which is setting up as the session progresses
2. Structure chart
Purpose: Identifies the structural expectation of highs and lows as the market auctions through the day
3. Footprint chart
Purpose: Provides the interaction between buyers and sellers. An evaluation of delta (bid ask) and cumulative delta is used. The footprint delta bar is used for entries.
4. No indicators except ATR, key reference lines, rectangles and fibs
---------------------------------------------------------------------------------------------------------------------------------------------------------------------------------
Market: Futures – Equity Index Futures (ES, NQ, YM, RTY), FX Futures (6E - EUR/USD, 6J - JPY/USD)
Regular Trading Hours (Cash Market): 9:30 - 16:00 EST (All), 20:00 - 22:00 EST (6J)
---------------------------------------------------------------------------------------------------------------------------------------------------------------------------------
Common Terms Used in the Journal
Balance = A market state where neither buyers nor sellers have control and price rotates within a defined trading range
Continuous Two-Way Auction Process = All financial markets facilitate trade (or doing business) through an auction process of bids and offers to buy or sell a financial instrument.
Cumulative Delta = The sum of all the individual bar delta's throughout a trading session or day
Delta (Bar) = Difference between buyers and sellers who place market orders (hit the bid or offer) within a candlestick or rotation
Excess = Marks the end of an upside or downside auction with a buying or selling tail of single TPO prints.
Initial Balance = An initial trading range in US trading markets which is in 60 minutes in length. This is at the discretion of the trader based on the market.
Mechanical Levels = Specific levels on a chart which shorter-term, under leveraged traders look for entries and targets.
One Time Framing = Trading periods that are making continuous highs or lows.
Open Interest = The total number of futures contracts held by market participants at the end of the trading day. It is used as an indicator to determine market sentiment and the strength behind price trends. Unlike the total issued shares of a company, which typically remain constant, the number of outstanding futures contracts varies from day to day.
Opening Range = The first 1-minute trading range
Other Timeframe Participants = Larger, institutional participants in the market.
Overnight Inventory = From the overnight session, it is the price movement from the settlement (or closing) price of the financial instrument. If the price was above the settlement price, the inventory is considered long and vice versa for short.
POC (point of control) = Highest number of TPO's printed at a single price level and represents the fairest price of the day (or where the most business was transacted)
Poor/Weak Lows & Highs = From the TPO chart, these are the highs and lows which occur in two different periods which are even (poor) or 1 TPO different (weak).
Short Term Traders = Shorter-term (daytime) traders who are generally undercapitalized and exit positions by end of day.
Single Prints = This is a single row to TPO's which are printed and separate two distribution areas
Settlement = CME end of day closing price for the RTH
Spikes = End-of-day price movements, which create an obvious spike and signal an incomplete auction.
Value & Value Area = Is approximately 70% of the TPO's traded in a trading day
--------------------------------------------------------------------------------------------------------------------------------------------------------------------------------------------------------------------------------
Good work is the key to good fortune