{quote} EURJPY strong buy JPY should move PA to 131.341 where is D1 support / resistance pay attention to 131.474 - 131.279 for support after 12 days of sell
NZDCHF D1 indicate buy mode - PA above 0.65192 confirm TP 0.66038 - 0.66507 EDIT H4 enter in sell mode @ 0.65423 I would like to see push down to 0.65111 - 0.65027
Ignored
NZDCHF
fishing buy @ 0.65111
SL around 0.64900
Forex can only be understood backwards, but it must be traded forwards.
Can you please give more details on how you come up with the lines on the chart.
The different daily/weekly support lines are from different days/weeks or what?
{quote} Can you please give more details on how you come up with the lines on the chart. The different daily/weekly support lines are from different days/weeks or what?
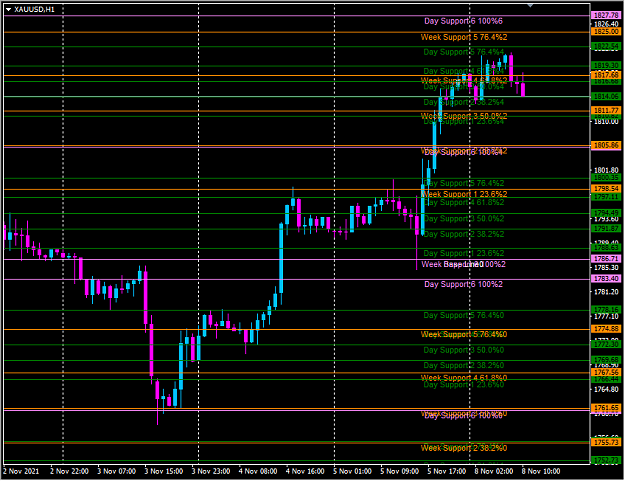
{quote} on post3 and here I'm calculating time and money for different TF {image}
Ignored
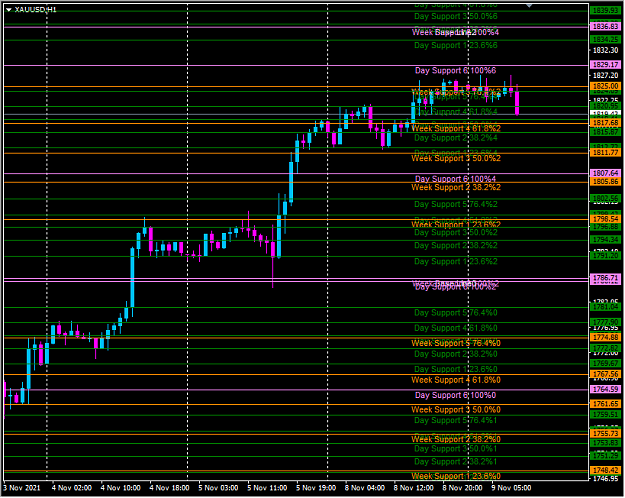
Thanks. What I mean is, for example, you have "Daily Support 6 100%2" and "Daily Support 6 100%4". Are these the support lines for two different days for example, or what?
{quote} Thanks. What I mean is, for example, you have "Daily Support 6 100%2" and "Daily Support 6 100%4". Are these the support lines for two different days for example, or what?
Ignored
there is a difference between those two.
"Daily Support 6 100%2" - is first block of resistance
"Daily Support 6 100%4" - is second block of resistance
it should print word "Resistance" but I didn't know how to program that on MQL4
Forex can only be understood backwards, but it must be traded forwards.
{quote} there is a difference between those two. "Daily Support 6 100%2" - is first block of resistance "Daily Support 6 100%4" - is second block of resistance it should print word "Resistance" but I didn't know how to program that on MQL4
Ignored
You can compare the price of Resistance lines and base line to change "Support" to "Resistance"