{quote} Please Sir i try to upload only the CPP File but the system here says the file not supported, so i upload all the folder please the CPP is in the folder attached {file}
It would be appreciated if one of the coders here could code a Fibonacci indicator that auto calculates the period between two date & time parameters.
Ignored
Hey, Richard, is this what you are looking for? AllPivots has Q1, Y1 Pivots, both ATR and also various other options which are widely customizable. Surely it may not have all you have listed, but hey, isn't it better than nothing?
{quote} hi jean mate you'r great coder and you are helpfull too .i really appreciate it. Do you consider to create one dashboard based on bulish ,bearish engulfing , inside out side bar , piercing ,darkcloud candlestick if it is too much than just bulish bearsish engulfing only. It will be great scanner for any trader imho.thanks in advance
Ignored
any master coder please create one dashboard .thanks in advance
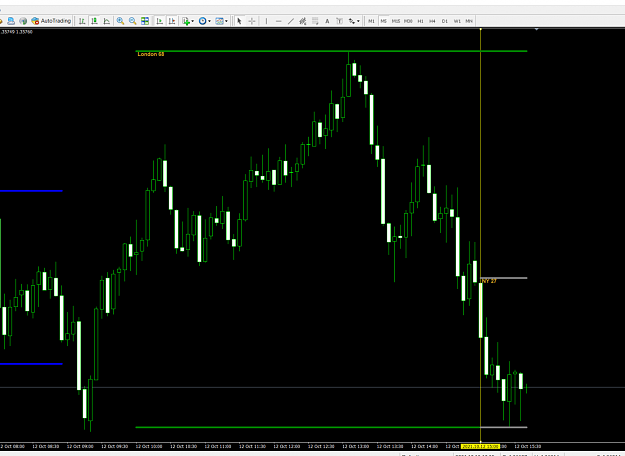
Good day to those helping this thread, please be well assured we value and appreciate your effort and time always, may you continue to succeed in all your life endeavors, may you continue to remain blessed!! please i have used Google to search before posting this, and i cant find any other option that is as good as Auto-session indicator at session open the attached indicator prints two lines, one for open and the other will be for close, its the only session indicator i can find using H-line high/low is it possible please to help remove the close...
Ignored
is it possible please to help remove the close lines high/low (session close), so that i can see only the high/low(session -open) like screenshot P3
The lines you have are not Session Open/Close.
They show the High of the Session, and the Low of the Session.
You cannot have a High/Low of the Open. It is going to be a specific Price.
You can only have High/Low of a range.
{quote} is it possible please to help remove the close lines high/low (session close), so that i can see only the high/low(session -open) like screenshot P3 The lines you have are not Session Open/Close. They show the High of the Session, and the Low of the Session. You cannot have a High/Low of the Open. It is going to be a specific Price. You can only have High/Low of a range. Did you mean you Opening Price of the Session?
Ignored
Yes Sir i think it should be the high/low of the range, or high/low of the session,
please you understand the code better
the plan is that one line should be left at the high or low of london,newyork,sydney session
{quote} Sure. I can add a few options to shorten/shift. My screen is a large screen so I didn't notice that one. Try to change font to smaller one if that helps. Here is updated version. It has now Xpostion,Yposition, Spacebetween as input so you can adjust label positions in chart window. Also, it has Show options for each timeframe. {file}
Ignored
this is excellent indicator to watch/monitor single pair either moving or ranging which very important to understand smart money accumulation ,distribution, my humble request please create one multi pair dashboard so we can watch/monitor multipair . if possible please ad 2 more column
1.adr and percentage change
2.total pip change day/week/4h/1h so we can recognize which pair most active/market moved
{quote} Yes Sir i think it should be the high/low of the range, or high /low of the session, please you understand the code better the plan is that one line should be left at the high or low of london open and one keep moving with the price until session closes
Ignored
A dynamically moving High and Low of the sessions?
It already does this.
Image: GBPUSD:
Image shows the opening of the US session (I have added the yellow Vertical line for clarity)
Note the Grey Line: The High is shown, and the current Low.
As the day progresses, the lines will change.
{quote} A dynamically moving High and Low of the sessions? It already does this. Image: GBPUSD: Image shows the opening of the US session (I have added the yellow Vertical line for clarity) Note the Grey Line: The High is shown, and the current Low. As the day progresses, the lines will change. {image}
Ignored
please is it possible to make it just one- horizontal line? so that no green line is present at the session close
for example in your picture is it possible to leave only the top green line at the start, so that london session will have only one green line
only one H-LINE london session
only one H-LINE newyork session
only one H-LINE sydney session
{quote} please is it possible to make it just one- horizontal line? so that no green line is present at the session close for example in your picture is it possible to leave only the top green line at the start, so that london session will have only one green line only one H-LINE london session only one H-LINE newyork session only one H-LINE sydney session
Ignored
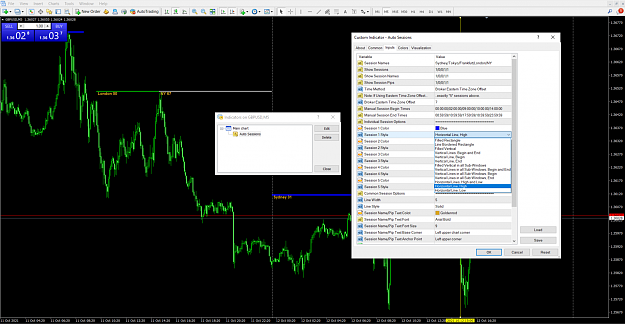
You can show the "top" green line by selecting "Horizontal Line High" from the standard features of the indicator.
Note: there is NO "session close".
Only a Session High and Session Low.
{quote} You can show the "top" green line by selecting "Horizontal Line High" from the standard features of the indicator. Note: there is NO "session close". Only a Session High and Session Low. {image}
Ignored
thanks so much for your time and efforts, if i choose i may not be at the right side of choice
my thought was while the indicator on chart, normally at the session open, the price line print two lines, price will push one line to the first low/high of session and close with the other since the lines start printing on session open, let the market decide what will be the high /low of the day
since the price push the lines to stop on the first low/high of session then the line remains
i have indicator that print Hline on the open time/price but not on high /low,
just trying to determine the starting point of first high/low of each session
is it possible for the indicator to print just one line, then price push the line to first high/low of the session, then if the price reverse it will be with no lines to print/please can you help to change one of the lines to black and indicator autu select only one color, since i always use black background it wont show
i attach the one i have but its not printing high/low, but with just one Hline for each session,
it will be nice instead of printing on time/price but on high/low
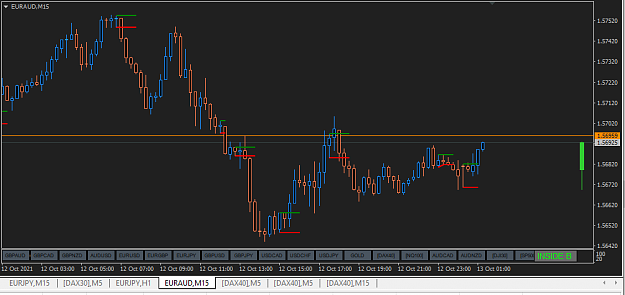
on the attach screenshot i only set London open just as example
Hello Coders , I was hoping that someone can create an EA. Time Frame 1 minute, 200period EMA , when price crosses the 200 ema either up or down it triggers an entry and continues to trigger an entry every 2 pips above the entry for buys and below the entry for shorts . If in a buy trade for example the EA continues to open orders every 2 pips until price crosses below the 200 EMA by 2 pips and it closes all Buy orders and starts to open Sell orders every 2 pips.So basically their is no stoploss or take profit,it is continuous until you decide to turn it off. Thank You Kindly very much appreciated. PS I forgot to mention the lot size is the same for every entry until you decide to change it. PSS the EA will only open a new trade above or below the last entry by 2 pips so if price retraces it will have to reach the last entry again to start placing new trades i hope that makes sense. Can we also have the option to select the pip distance 1, or 2 pips Thanks
{quote} Hey, Richard, is this what you are looking for? AllPivots has Q1, Y1 Pivots, both ATR and also various other options which are widely customizable. Surely it may not have all you have listed, but hey, isn't it better than nothing? {file}
Ignored
Thanks Julius will check it out
When you are successful perhaps give a thought to others ... Kiva dot org
{quote} Hi syndicat According the indicator, I trigger the orders with this EA. Very useful and reliable. Maybe Ezios can use lines of code for a new EA about the idea above ? {image} {file}
Ignored
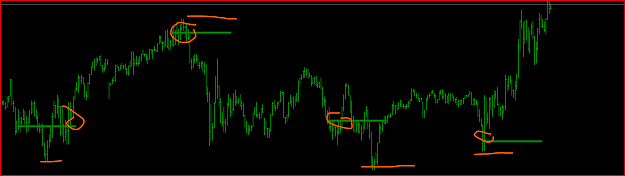
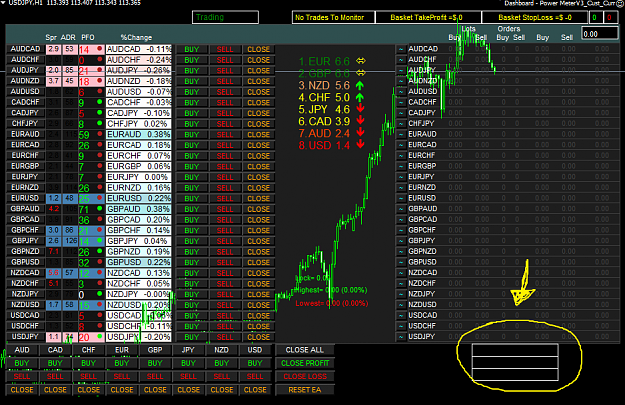
dear madscalp and all coder....anybody know how to remove border line at i mark in cycle...i just found to hide for cm only.
Hope someone can help me.
{quote} Greetings dear Jean ! I have a MTF stochastic indicator that needs a slight modifications (based on the screenshot below), the request is as follow : 1. Show green arrow when stoch D crosses above K & vice versa show red arrow when stoch D crosses BELOW k & ALSO DRAW A Vertical line whenever stoch crosses 2. Show the text at the side BUY TRADE (in lime color when green arrow appears ) , Show the text at the side SELL TRADE (in RED color when red arrow appears ) Thanks a lot in advance if you can do this slight modifications to make my trading...