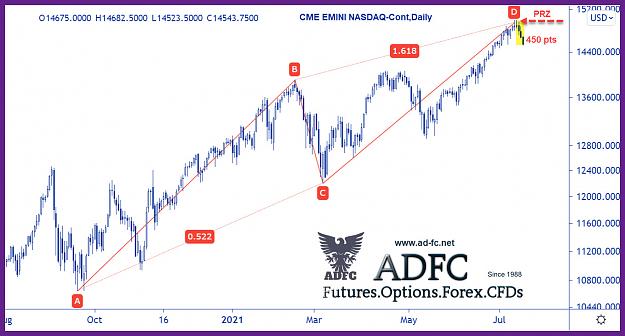
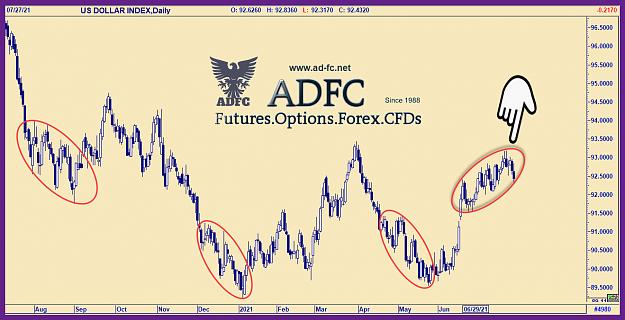
First, we shrink down the chart to make it a YTD chart.
Then, we start the calculations for the True Range values, as prescribed by
the Turtle Trader method.
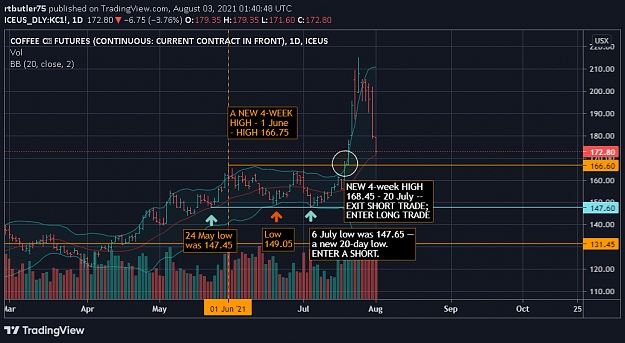
To determine the entry and exit (LONG): 1. For each day, keep track of the O,H,L,C prices. 2. If you are using system 1: a) locate the day when the price hits a four-week high; then b) enter a long trade the next day.
Of course, I have a lot more math to do--this is just backtesting.
HELL IS EMPTY, ALL THE DEVILS ARE HERE. -- Shakespeare
SHORT ENTRY.
The three arrows point to low prices. The orange arrow points to a low, but not a four-week low, so there was no short entry. The short entry came at the
second pale-green arrow, as that was the latest four-week low. (The first arrow
points to a price which was over four weeks old.)
Attached Image (click to enlarge)
However, the price reversed direction and started climbing. According to the rules,
when the price reaches a new two-week high after a short entry, we are to close
the short trade (in this case, the trade cost us money).
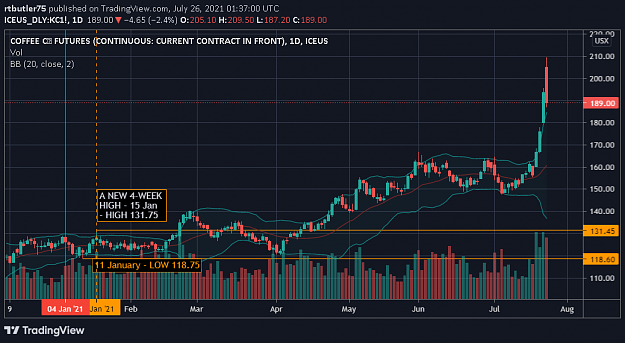
The circle indicates a new four-week high, and as a result, this is a long entry.
We'll soon find out if this is a sustainable rally, as there is heavy profit-taking
in the last few days on the chart.
Girlie pic :
Attached Image
HELL IS EMPTY, ALL THE DEVILS ARE HERE. -- Shakespeare
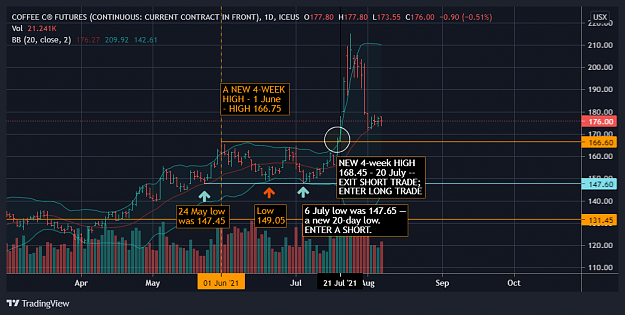
One thing about the Turtle Trading method:
according to the book, you are not supposed to start closing your position in order to "lock in" profits. This is in complete contrast to DIBS, which insists that you aim to close 50% of your trade to lock in profits after
an appropriate level has been reached.
This is one thing I would change about the Turtle Trading method,
especially after seeing this week's activity:
Attached Image (click to enlarge)
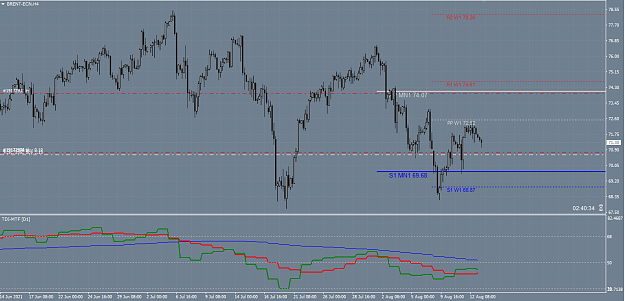
As per the rules, one is supposed to enter the market the day after a new four-week high is reached. Since the four-week high (circled) was reached
on July 20, the vertical black line represents the day of our entry, July 21.
At the very worst, with slippage, we would have bought in at the high
of 177.90.
The price continued to escalate until July 26, when the high price reached 215.20.
At some point in that price gap, one could have closed part of the position
to lock in some profits--even though the Method says, don't think--just follow the system.
The gains made on the 26th have faded (so far), but we haven't reached a
two-week low yet, so there is no bailout signal.
Attached Image (click to enlarge)
HELL IS EMPTY, ALL THE DEVILS ARE HERE. -- Shakespeare
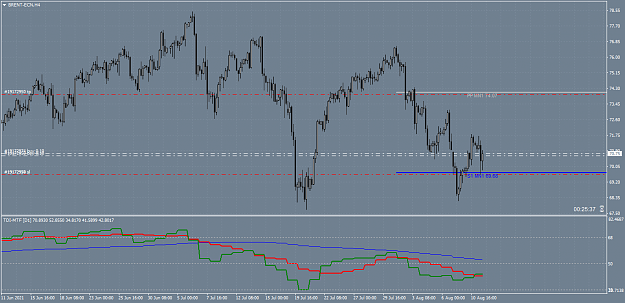
Attachment g
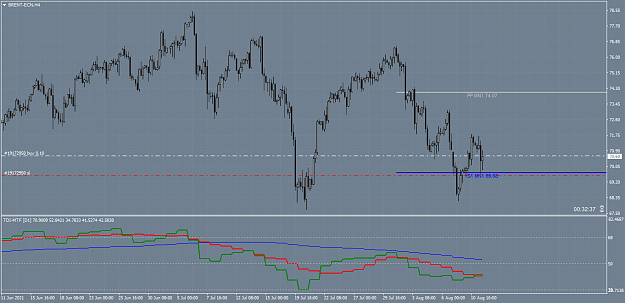
There are two vertical black lines that highlight candlesticks in July and August.
The price dipped to a low at the second black line, but it was not a two-week low,
so a short trade was not entered. Judging by the S1 rules of Turtle Trading,
we are still in a long position, which was triggered by the four-week high on July 20th (circled in white).
Attached Image (click to enlarge)
HELL IS EMPTY, ALL THE DEVILS ARE HERE. -- Shakespeare