Loving the chat here about market flow etc, have opened a CTrade account to gain further experience away from MT4, would love some help towards where I would find an indicator like I see on 392. Blessings to you all
Ignored
Greetings, Getting my head around this new software, have found the standard DOM indicator, would still like to be able to get the chart into full screen if one of you kind fellow traders can help please.
DJ
Loving the chat here about market flow etc, have opened a CTrade account to gain further experience away from MT4, would love some help towards where I would find an indicator like I see on 392. Blessings to you all
Ignored
DonPato has posted this indicator severally on this thread if you can have a careful look at it.However here is the link to the indicator: https://www.algodeveloper.com/product/volume-profile/
Although the content on this thread is far more important than that indicator.
Hi DonPato, how would you interpret this "daily candle"?
Ignored
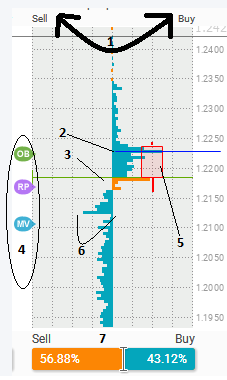
In order for me to answer your question I need to know what I'm looking at...I have looked at this several times and can't seem to figure it out. I have noted your graphic and have specific questions for each number listed:
Is this a liquidity graph? In other words does the histogram listed show potential (unfilled) volume or transacted volume? If it is a liquidity graph it is backwards. The Sells should be ABOVE the current price and the Buys should be BELOW the current price. I am assuming that the current price is the green line (#3). So it is clearly NOT liquidity (passive waiting) orders. If it is transacted volume then what do the colors mean? I see the blue color in both the buy and sell column...so the entire graph makes no sense from an order flow point of view.
Is this dark blue line the VPOC? (Volume point of control?) or is this line the VWAP? (Volume weighted average price?) There is usually a huge difference in how the two are calculated, and shown on a volume graph...
Is the green line the close, or current quoted price? It would appear this way as that is where you have a body of the red candle.
What do these symbols listed on the left side of the graph represent?
Does this red candle (I assume a bearish candle) represent a day's price activity? If so did you draw it in by hand?, or is this drawn by the program? If it is rendered in the program, where are the other days prior to this candle?
What do the length of these histograms (on the vertical axis) represent? Is this volume? If so it is in lots, (true volume) or transactions (tick volume)? I see you gradient on the other vertical lines to show a measurement...only the horizontal axis...this seems to be price.
What does the BUY/SELL graph at the bottom of the screen shot represent? Is this like a commitment of traders view? In other words are these open positions, or closed transactions?
This appears to be something taken from a screen shot on an oanda platform, and if it is, please keep in mind that any volume information given is confined to their own internal market. Not the overall market at large. In other words, it is showing transactions from strictly oanda platform traders.
Finally what market is this? I tried to figure it out by looking at my own platform, but didn't feel like slogging through all 65 markets available and comparing each one...in addition there is no date given so I don't even know what day this is?
When you have some more well defined information, please present this and lets have a logical conversation. To present me with some (apparently) self constructed graphic with no data to accompany it is like shooting in the dark with a blind fold.
{quote} Greetings, Getting my head around this new software, have found the standard DOM indicator, would still like to be able to get the chart into full screen if one of you kind fellow traders can help please. DJ
Ignored
I will let other traders who are more adept at programming answer your specific question about the cTrader software and the indicator that is used. I didn't write either one, and cannot speak intelligently to its function or calculations.
My only point in using it here is to illustrate the topic of this thread...how the order flow effects and creates price movement...NOT the other way around.
{quote} Greetings, Getting my head around this new software, have found the standard DOM indicator, would still like to be able to get the chart into full screen if one of you kind fellow traders can help please. DJ
Ignored
Hi Coffeebuff
In the end, if you want to trade from signals directly off the DOM, the best way is to invest in obtaining data from a futures pair and then trade it on your current trading platform. This way you will get to see how the big players manipulate price by applying pressure to one side of the order flow columns.
Cheers
Trading thin liquidity at the boundary of the charts
{quote} In order for me to answer your question I need to know what I'm looking at...I have looked at this several times and can't seem to figure it out. I have noted your graphic and have specific questions for each number listed: Is this a liquidity graph? In other words does the histogram listed show potential (unfilled) volume or transacted volume? If it is a liquidity graph it is backwards. The Sells should be ABOVE the current price and the Buys should be BELOW the current price. I am assuming that the current price is the green line (#3)....
Ignored
It's from Oanda's order book EURUSD graph, clean buy/sell open positions from Fridays daily candle (I drawed the candle on the graph) the green line is the close of the candle and the blue line the most of the volume. Sorry, I didn't gave other info, because I just wanted a clean answer for the drawn candle on the graph. I hope you can answer without being distructed.
{quote} It's from Oanda's order book EURUSD graph, clean buy/sell open positions from Fridays daily candle (I drawed the candle on the graph) the green line is the close of the candle and the blue line the most of the volume. Sorry, I didn't gave other info, because I just wanted a clean answer for the drawn candle on the graph. I hope you can answer without being distructed. Thank you.
Ignored
I'm not sure what you mean by a "clean" answer...however, I would reiterate that with Oanda's platform, they are not giving you the FX market within the interbank volume...they are only giving you the positions and transactions of Oanda's traders. It is a tiny fraction of the market and cannot be relied upon as accurate to the larger market
That being said, it appears from you graph, as there was ONLY buying occurring within the price range of your candle (drawn by hand). Again, this clearly doesn't make any sense because with ALL buying and especially since the price candle finished bearish, even the graph at the bottom would seem to indicate a majority (if only slightly) selling...there had to be some selling going on inside the candle but your volume graph doesn't represent this...Thus again...it makes no sense! It is NOT a good indicator of order flow. If I was looking at this I don't think it would help me make good trading decisions
The whole idea of DELTA volume is to show which side of the order flow is more active, and then watch how price responds to it...indicating the passive side of the market...This graphic you posted does none of that.
So is this answer "clean"? I kind of doubt it. You need to use the tools you have in the way they were intended to be used. It is not profitable to force market structure onto something that wasn't designed to show it.
{quote} I'm not sure what you mean by a "clean" answer...however, I would reiterate that with Oanda's platform, they are not giving you the FX market within the interbank volume...they are only giving you the positions and transactions of Oanda's traders. It is a tiny fraction of the market and cannot be relied upon as accurate to the larger market That being said, it appears from you graph, as there was ONLY buying occurring within the price range of your candle (drawn by hand). Again, this clearly doesn't make any sense because with ALL buying...
Ignored
Clean I meant the most buyers without the sellers and the opposite (net volume) I think that the graph says it all and it is how you, or I use it that makes it different.
Thanks for the answer, it gives me the answer that I search for. Have a great day!
{quote} First of all I want to thank you again for your kind words and your patience with my response as I have been involved in many issues of a personal nature that have occupied my time for many months. Thus I have not been as active on this forum as I could be...and (due to just down right nasty behavior) I have been very disappointed in the responses of some individuals, leading me to question the purpose of doing this...that being said I have decided to divide my response to your question into three posts, so please, bear with me. Preamble:...
Ignored
First of all I would like to apologise for the late reply.I have recently travelled and I wanted to have adequate time to read thoroughly through your response as I always value the effort you have put into this thread.I wanted to get your perspective of the market from the same chart I had drawn my personal view.It may help me broaden my thinking in evaluating when different scenarios present themselves in the future.So thank you for your response!
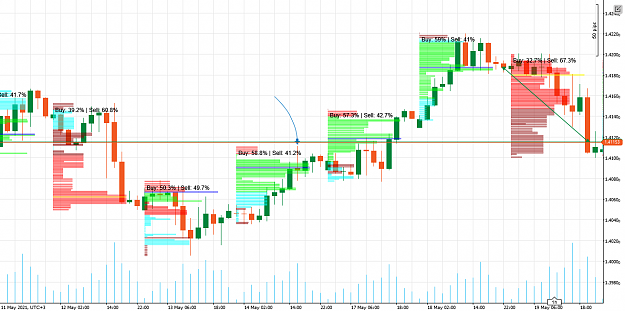
{quote} {image}The short answer to your question is "yes". This is reverse order flow. I would see this as day traders taking profit on longs ahead of the close of the day. It is very common and nothing that I would see as unusual or "wrong". Keep in mind the market is made up of many different participants each with different objectives and time frames. Thus I see this as a "normal" progress of price along with order flow. Buying dominated the entire day, AND, as a result, prices rose. Further, at the end of the day, selling came in and prices...
Ignored
Regarding the first order block (1),as I had noted,majority of buying occurred from the top half of the candle compared to the liquidity at the lower prices of the same candle.In my understanding this would be a greater amount of orders streaming in and being filled at those prices,therefore more orders,more volume,the higher the prices should go?
As you have put it correctly,the selling came in and prices slightly fell.My question,with the higher volume registered on the buying side,shouldn't the prices rise way higher (climax)?This being the anomaly as there is an absorption candle right there,I have marked that with a blue pencil which seems to have absorbed the the buying liquidity and would be a possible indication for short?
{quote} {image}The short answer to your question is "yes". This is reverse order flow. I would see this as day traders taking profit on longs ahead of the close of the day. It is very common and nothing that I would see as unusual or "wrong". Keep in mind the market is made up of many different participants each with different objectives and time frames. Thus I see this as a "normal" progress of price along with order flow. Buying dominated the entire day, AND, as a result, prices rose. Further, at the end of the day, selling came in and prices...
Ignored
That makes a lot of sense.The selling did not change the overall buying delta.Thank you for that observation.
I will continue posting up charts for discussion as I have found these insights very helpful.Thank you again.
...,therefore more orders,more volume,the higher the prices should go?...
Ignored
This is usually the case...but keep in mind that the Delta volume indicator shows only the active side of the market. The passive side cannot be seen. Thus if prices do not rise, or if it takes much more volume to effect a rise, then prices have reached an area of dense liquidity. Although unseen it is perceived by the price response to the active order flow.
What you saw was some absorption by an area of liquidity. Many refer to this as "resistance". But as explained above, yes there was some absorption occurring...but it was limited and price pushed through it closing the day above the VPOC. (Volume Point of Control). Even after the small sell off at the end of the day. This is why I wait (or at least try to) for the close of each day's activity before making a decision to act. Often times the last few hours of a candle completely change the final order flow profile and thus also the decision I make.
{quote} This is usually the case...but keep in mind that the Delta volume indicator shows only the active side of the market. The passive side cannot be seen. Thus if prices do not rise, or if it takes much more volume to effect a rise, then prices have reached an area of dense liquidity. Although unseen it is perceived by the price response to the active order flow. What you saw was some absorption by an area of liquidity. Many refer to this as "resistance". But as explained above, yes there was some absorption occurring...but it was limited and...
Ignored
What indicators, other than volume, can be used to roughly measure density, absorption, volume point of control, distrbution and accumulation?
I trade with daily open as the axis in my quest to extract volatility or the lack of it. Measuring velocity of mometum rather than identifying and targetting breakout is on my agenda. Besides my brain, which indicator can help me? Trading is all about finding clues. Does volume give a clue as to the momentum speed?
{quote} What indicators, other than volume, can be used to roughly measure density, absorption, volume point of control, distrbution and accumulation?...
Ignored
All these metrics are functions of volume. Thus if not by using the volume itself (especially Delta), what other indicator would be of any use? Since price and volatility are all functions of order flow/volume... any other indicator would add a superfilous layer that is unnecessary and in fact detrimental to your decision making.
{quote} All these metrics are functions of volume. Thus if not by using the volume itself (especially Delta), what other indicator would be of any use? Since price and volatility are all functions of order flow/volume... any other indicator would add a superfilous layer that is unnecessary and in fact detrimental to your decision making.
Ignored
How about the change in Pips from Daily open, percentage change from Daily Open?
This is not a layer.
How about the change in Pips from Daily open, percentage change from Daily Open? This is not a layer.
Ignored
I would like to encourage you to read this entire thread from the begininning. I know that sounds like a lot to ask, but I have explained this very thing and I am not accustomed to repeating the same message over and over again. To summerize. "change in pips" means price movement. ALL price movement is the result of order flow/volume. This is the structure of the market. The fact that you even ask this question here...in a thread about order flow, shows me you don't really understand the relationship of orderflow/volume on price. This is why I am asking you to read this thread entirely. I have explained it as well as it can be explained.
So your quesion at the end is basically...is price a layer on top of the orderflow? I guess one could see it that way. However, I see, price as the final component of the market structure. Hidden within your question is also the component of time. (You mentioned a "daily open"). Why a daily open? Why not a weekly, or monthly open...why not the open of each major session around the world...Tokoyo, Frakfurt, London, New York? Time is a major component of the market structure as well. All these things combine to produce the quote you see at any given moment on your screen. Time, Orderflow, Volume, and finally Price.
Graphing price movements over time, does very little to show you the true nature of the market. You must inclue the other two major components of the market as well...Orderflow and Volume. Without Time, Orderflow and Volume...you will not get price...its just the way the market works. Once you truly understand this relationship, your trading will move to the next level and you will suddenly "see" the market as you never have before. This will lead you to literally pull money out of the market, seemingly at will.
Hi Don,
I would like to introduce myself and at the same time thank you for all the time and effort you have put into this excellent thread.
I have been trading spot Forex for a number of years using a very simple price based strategy with a little bit of fundamentals. It works well enough but for some time now the question about volume has been gnawing away at the back of my mind. A couple of years ago I started making a serious effort to incorporate volume into my trading strategy. Up until now these efforts have been mostly met with frustration and disappointment. The picture that I kept coming up with was like a jigsaw puzzle with several key pieces missing. For me, that doesn’t provide a solid or coherent structure on which to base a trading strategy.
It also appears that many traders are quite hostile to the idea of using volume as evidence by this post on your thread
Quote
Disliked
whiteout #post 222 Always amazing reading thread about 'delta' 'orderflow' 'volume' and no mention of the fact that the bid/ask data you are feeding to your metatrader are no more than a joke. A basic course about market data/structure should be mandatory for anyone who wish to talk about the subject, otherwise shitload of misleading information are spreading out like a disease. Sorry for the rant, don't wonna be a dick, but this is really misleading for people trying to understand how the market works.
back to the limbo..
I have to admit that I was also quite sceptical about some of the claims about using fx futures and tick data to determine delta. When I started looking at some of the valid research that has been done on this subject and supplemented it with my own investigations, I found that everything that you have said about this to be completely valid. This has gone a long way to helping me complete my own jigsaw picture of market structure knowledge.
I note that a number of times, people have asked you about indicators and algorithms for calculating delta. I have done a bit of work on this subject and I am more than happy to share it freely with anyone who knows what they are doing and is able to make proper use of it. I don’t however want to post indicators etc on this thread since I believe that can attract the wrong sort of attention.
I also want to make it quite clear that I am not selling anything as I have been falsely accused of on another thread. I simply want to avoid getting caught up in all the pointless stupidity that I have observed elsewhere on this forum.
I have twice read though this thread from beginning to end. I have made copious notes, carried out various test and experiments etc and even taken a few experimental trades based on order flow.
By no means have I mastered this subject. On the contrary, I feel I am just getting started but thanks to your efforts I now feel I am doing so on a solid theoretical footing.
Finally, I would like to say how pleased I was by your initial post, where from the beginning you strongly discouraged the naysayers etc. I think you have done a masterful job of keeping this thread free of these annoying and potentially destructive people. I simply take my hat off to you.
Maybe I have enough to go on with or maybe I will need to ask a question from time to time but I will keep an eye on all your future posts, wish you all the best and again offer my heartfelt thanks.
I have to admit that I was also quite sceptical about some of the claims about using fx futures and tick data to determine delta.
Ignored
To calculate delta there is only one option available - futures data. Because it contains the information about size and volume traded. Forex spot has no such a data so it is impossible to calculate the delta. Delta = difference, imbalance between buys and sells. The bigger the difference the bigger the imbalance. It called market inefficiencies.
There is only one way to make money in short-term trading - by exploiting market inefficiencies. We need to analyze the market, look for such inefficiencies and exploit them using algorithms.
Ordinary intraday trader cannot compete with a team of analysts and programmers by hand. The only way to survive, in the long term, is to seek and exploit those market inefficiencies that large players are simply not interested in.
BTW, CME announced micro futures few days ago. So there is no need to trade forex spot checking data from futures anymore. You can just trade micro futures where all the data will be automatically available.
To be honest order flow is really mitigation and mitigation is just order flow. 99% of people trade completely wrong. This video actually shows how to properly identify order flow and it shows you what order blocks are and how to trade them. in its simplicity, the video actually shows you how to trade like the banks to. I must say this got me started off on the right track. Good luck everyone !
To be honest order flow is really mitigation and mitigation is just order flow. 99% of people trade completely wrong. This video actually shows how to properly identify order flow and it shows you what order blocks are and how to trade them. in its simplicity, the video actually shows you how to trade like the banks to. I must say this got me started off on the right track. Good luck everyone ! https://www.youtube.com/watch?v=hwiUDKU9wgE&t=9s
Ignored
I watched the video and found it as shallow and un informative as most of the other threads on "structure". These are talking about "price structure" NOT the market structure. The method in this video does not talk about how or what causes these "major moves that 'break structure' ". It is a losing proposition from the get go. I strongly encourage you to read this thread in it entirety and you will better understand these comments. I wish you the best of luck!!