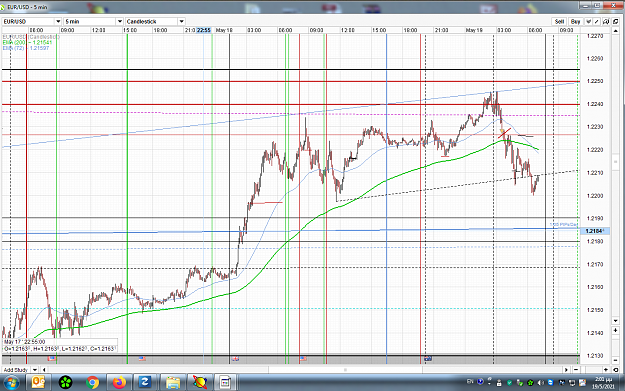
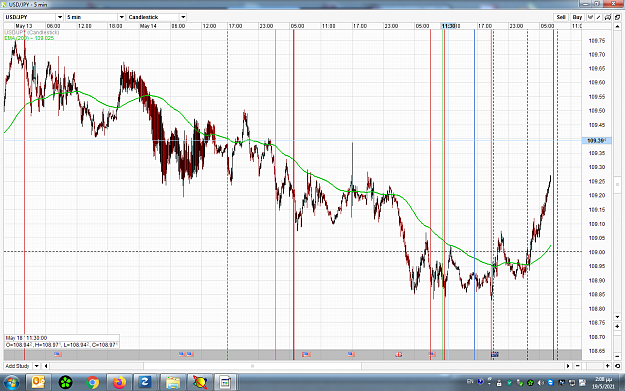
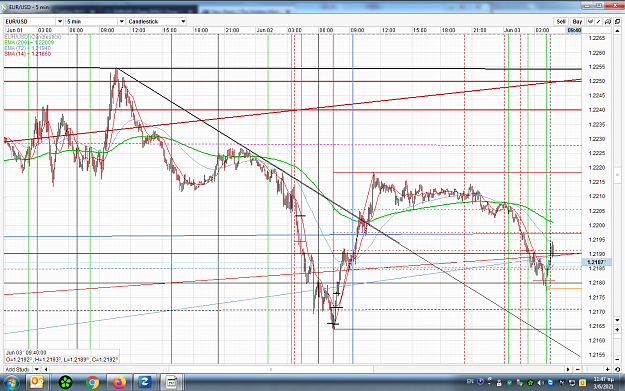
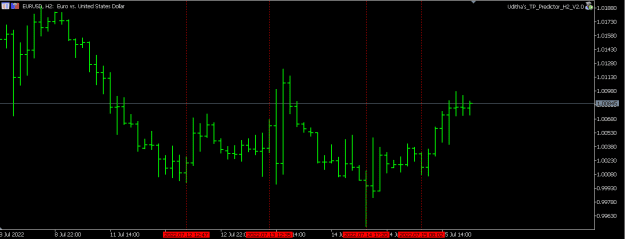
Man, hi. The 3 vertical DASH black lines are your 3 last signals.
The first is a nothing ...BUT a significant LOW in $JY.....
The second was a spot ON crest. Great...
The third is coming and we ll see ..... my signal is at 7:46
Regards
Magic or mathematical view of the market with 90% win ratio 14 replies
Hidden Pending Order and Hidden Trailing Stop Ea pls 4 replies
Mathematical reasons why MOST DayTraders & scalpers fail? 197 replies
VennD - Any Pairs - Any Style - Any Time 740 replies
chart formation mathematical expectation 5 replies
DislikedEUR/USD turning point on 1H chart which will occur on 2021.05.20 EST in 15 min time frame included. Click above link to see {image}Ignored
Disliked{quote} nice! i also had a turning point in the exact same place, but for completely different reasons and as for time, I knew not when what's the formula you use to calculate tp's? {image}Ignored
Disliked{quote} Hello it is based on a mathematical sequence which is related to law of vibration and also I use some fixed length cycles to find the exact turning point. I teach it. if you need more information, you can contact me at [email protected]. Also I have developed some indicators to predict 1min, 15min, 30min, 1hr, 2hr and daily turning points. However the method is completely independent from price ThanksIgnored