Disliked{quote} Why cant you post a print of that said display,for to better understandIgnored
// input values stored in s1 and s2 variables and s3
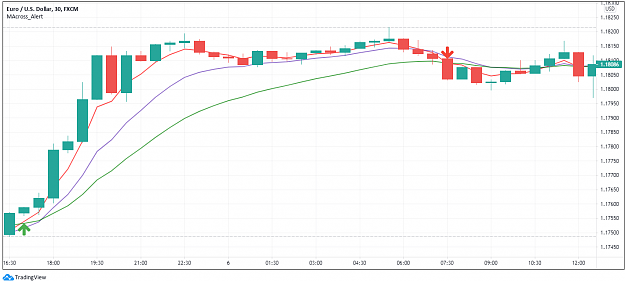
s1=,EMA_Fast (red color )
s2=EMA_Medium (blue color)
s3=EMA_Slow ( green color)
// Plots all the MA into chart
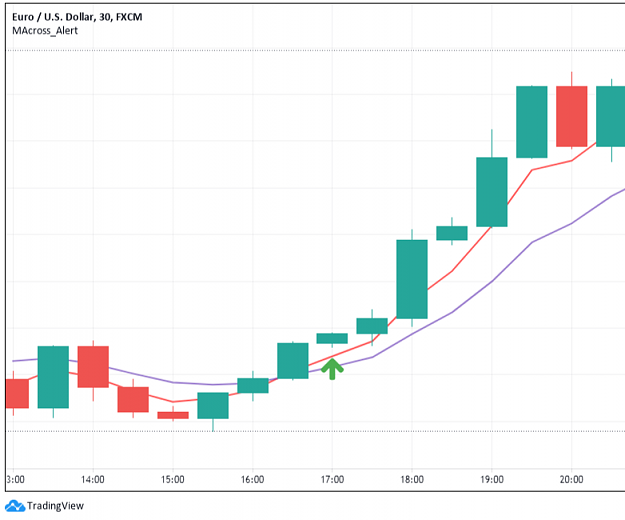
buy= s1ema cross s2 ema and s1 > s2 (red color ema cross blue ema )
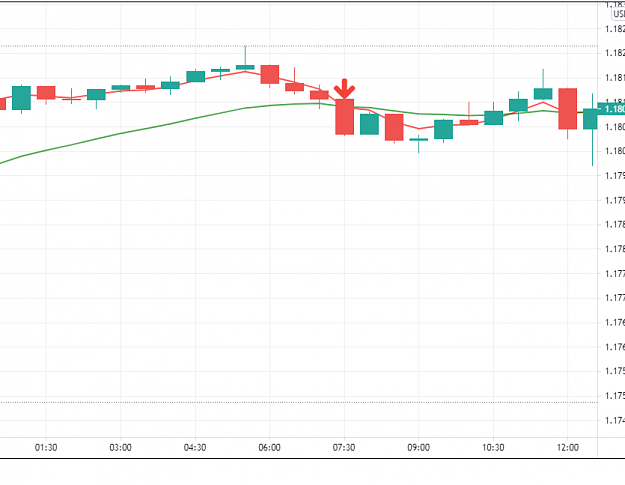
Sell = s1 ema cross s3 ema and s1 < s2 ( red color ema cross green color ema )
Exit buy = s1 ema cross s2 ema
Exit sell= s1 crossover s2 ema
I hope this text will be easy to understand.. And image with buy, sell condition..
I need ea based on this.. Thanks for your help
Attached Image(s) (click to enlarge)