Hi
I am a bit confused on how to identify the trend and how much data to take into account.
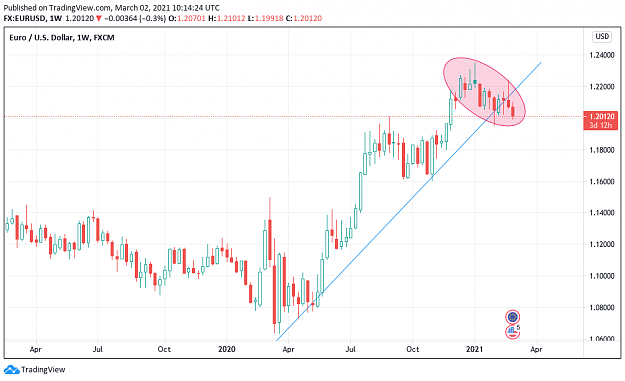
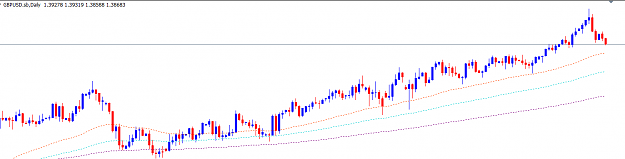
I the first image it is clear that the GBP/USD is in an uptrend
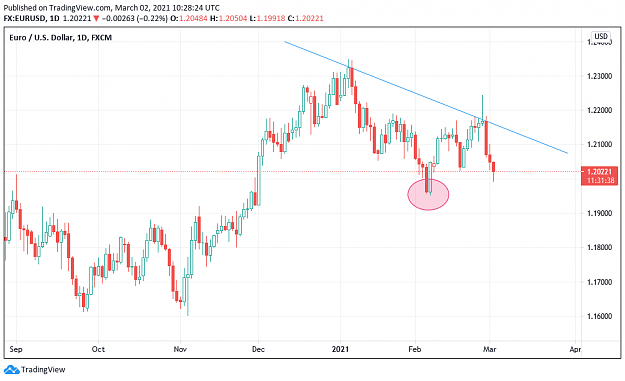
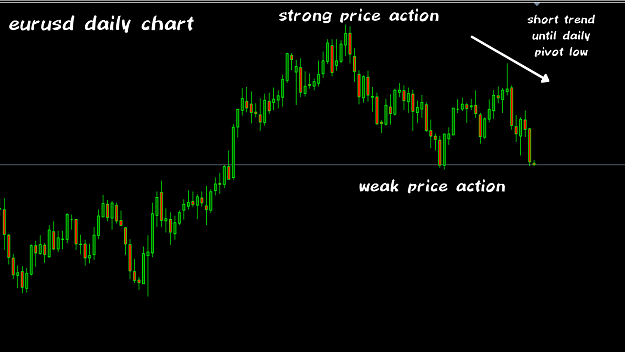
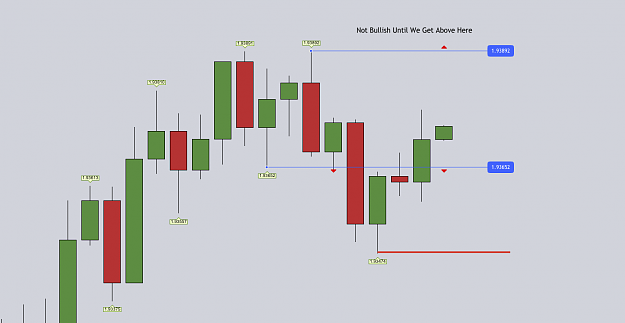
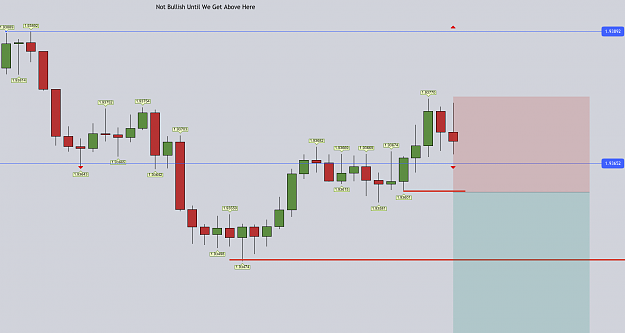
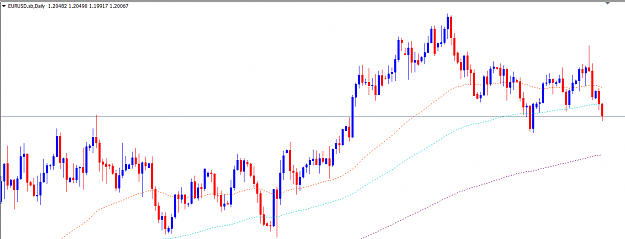
But what about image 2 of the EUR / USD is it in and uptrend / down trend or going sideways. Is this the pull back in the uptrend and I should be looking for buys or is it in a downtrend and looking for sells?
I am a bit confused on how to identify the trend and how much data to take into account.
I the first image it is clear that the GBP/USD is in an uptrend
Attached Image (click to enlarge)
But what about image 2 of the EUR / USD is it in and uptrend / down trend or going sideways. Is this the pull back in the uptrend and I should be looking for buys or is it in a downtrend and looking for sells?
Attached Image (click to enlarge)