Disliked{quote} What do you want exactly? a dashboard? adding column to some existing? % changes over yesterday? if adding to existing, can you show which one? and your desired output picture ( mock up drawing OK)Ignored
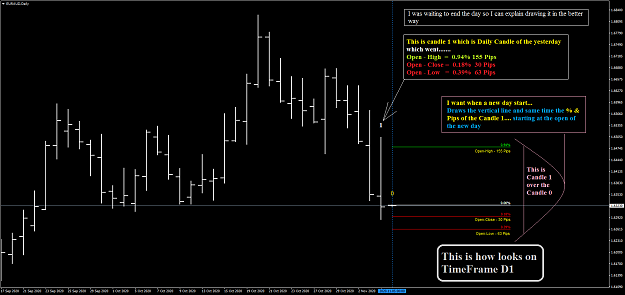
I was waiting to end the day so I can explain drawing it better
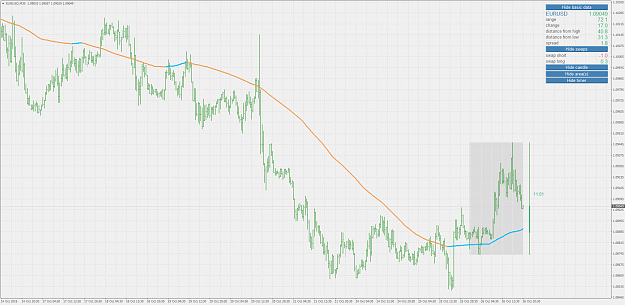
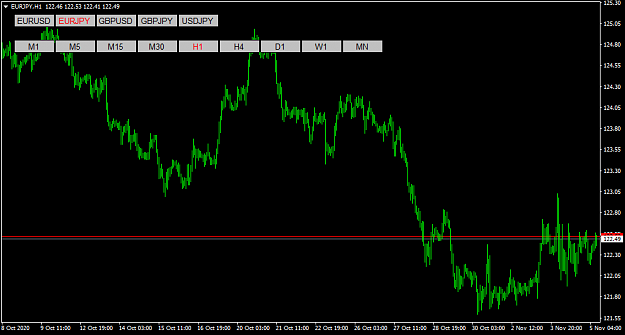
I want when a new day start draws the vertical line and same time the % & Pips of the Candle 1 starting at the open of the new day candle
In other words the data of Candle 1.... can be showed over the new day Candle 0
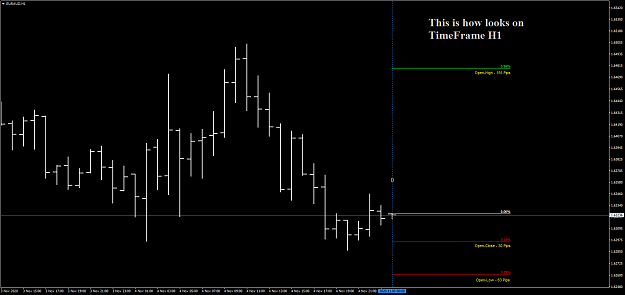
Indicator must be MTF for detailed explanations 2 images are attached D1 & H1
Hope this helps.
Regards,
Moti
Attached Image(s) (click to enlarge)