Disliked{quote} Just for your kind information For any alteration,it needs source code (mq4/5) - ex4/5 format files do not workIgnored
Thank you, will go dig and see if I can find it.
I have another request PLEASE :
I am looking for the following, sorry if my explanation sucks, hope I get it right..!
Im looking for a tool / indicator that can do the following :
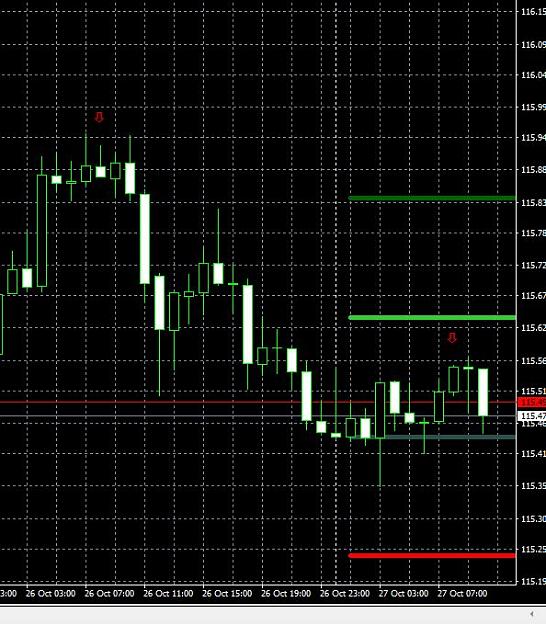
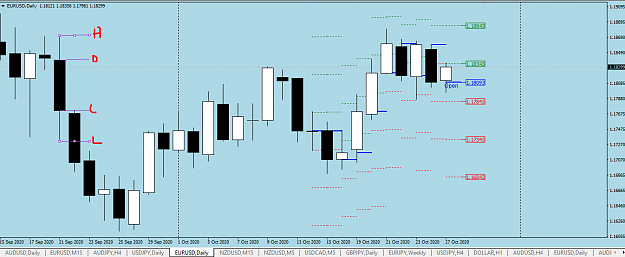
1...Draw a horisontal line, of which I must be able to enter start and finish time of the line, as well as price value of the line ( its gona be a horisontal line so one value field is sufficient)
Let us call this the centre or anchor line.
2...From that horisontal line, the indi must draw lines spaced with a value of 20 points each, and also the "half way lines" , in other words the 10 points in between.
3...It must be able to draw 3 x lines above the centre line, and 3 lines below.
This is of the 20 points points vertical spacing, and obviously the 10s in between
4...I must be able to set colours and line types, even if not on every line, just between the 20s and the 10s is fine.
5...It should stay as history on the charts, not only the live trading day, then gone.
EXAMPLE :
1.3060 3rd line above
1.3040 2nd line above
1.3020 1st line above
1.30 Centre Line of which I put in value and times
1.2980 1st line under
1.2960 2nd line under
1.2940 3rd line under
and the obviously the 10s as halfway points in between
oh, it goes without saying the 1,2,3 lines must copy the start / end times of the centre line
I hope someone has something like this to share, or one of the brainy genuises here can build this...