I was reading my math book (applied calculus) when I got the idea that what if Natural logarithm works in the financial markets. We all know that currency pairs and all other financial instruments at least have some supply and demand where fibo levels are.
Well then I started to study the natural logarithm(e=2.272) and also added e^2 which is 7.389, but because it it so large number I moved the point by one to the left(0.739). Because I tried to find some information about it related to trading but found nothing I just had to brainstorm and test whatever came to my mind. I found out quite quickly that if fibo retrace drawn from last swing before turning point, it can predict the swing length pretty accurate. Of course if it is in a powerful trend, price can brake the 2.272 zone and continue lower, but it usually finds some balance before it does, so one is able to draw a new retracement to indicate the length.
I've only traded it with low timeframes and mostly with DAX and EUR/USD. I've had some real success with this and hope that some of you could share your take on natural logarithm and maybe have some ideas come up from my trading strategy.
https://www.tradingview.com/x/jRnvSDT7/
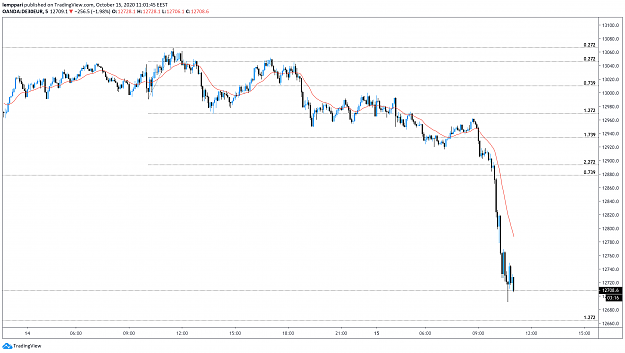
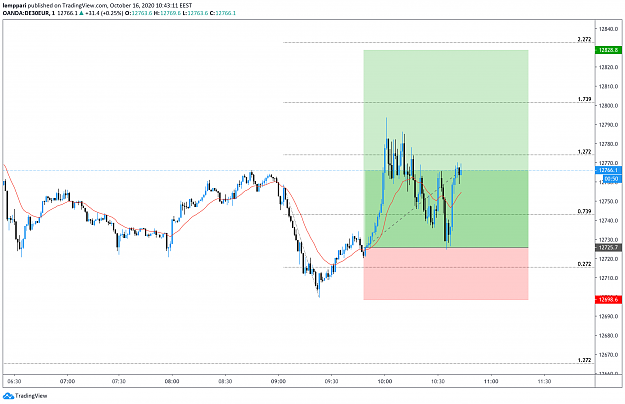
Here was the most recent trade from DAX. I use 0.272 line to get a confirmed entry signal and keep my hard SL under the last swing low. This provides a nice RR with pretty high win rate.
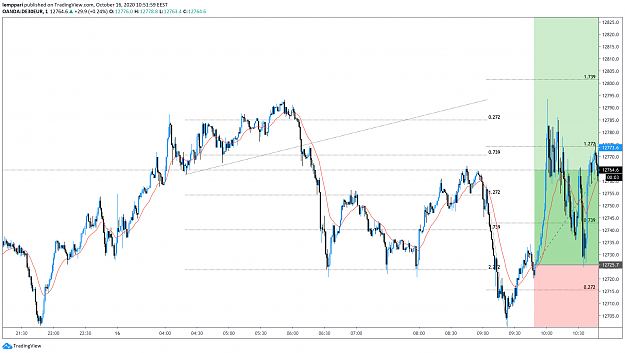
The thing here is to find the last completed "cycle" and try to find a move where to draw the retracement from. One need to take price action into account here. If the price rallies or drops to the 2.272 line its maybe better to wait for weakness or try to trade with the latest swing. Those other lines between 0.272 and 2.272 is just to help me move my SL when the trade moves towards the 2.272 area.
https://www.tradingview.com/x/ScyFyvAY/
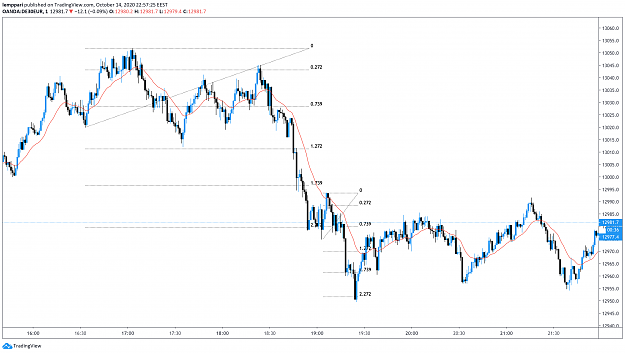
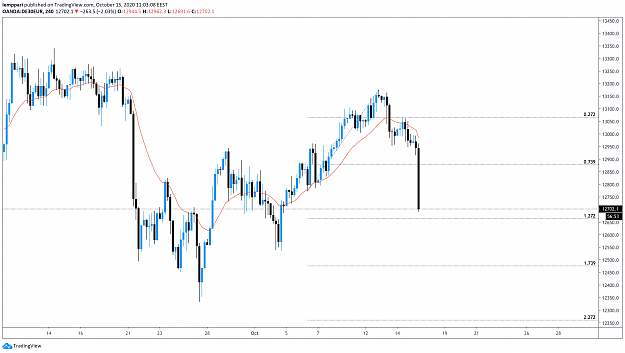
Here is one example from EU 1D. I've developed a 'feel' where to drawn the fibo from, but the basic line is that it needs to be the last swing before turning and if there's pullbacks in the swing it is probably safer to use the pullback high/low as one point in the retracement.
https://www.tradingview.com/x/JjNfY4QC/
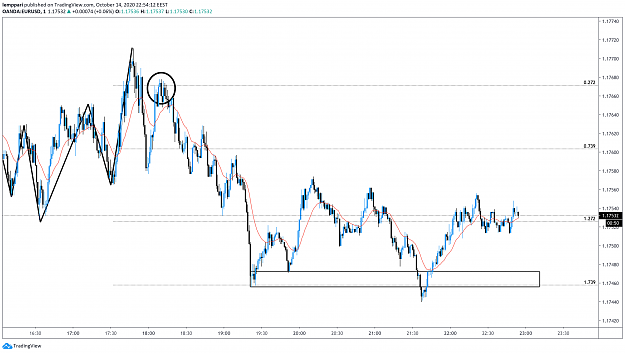
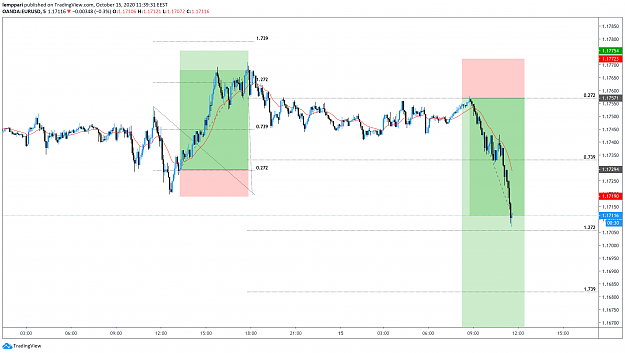
Here are some trades I ended up taking today. The last retracement drawn wasn't too clear so I ended up closing my position before price reached the 2.272 area. When price came to 1.739 area it formed a small head and shoulder and I decided to close the position when price came to test that 1.739 zone.
I hope you even understand something I'm trying to say here!
Please ask anything and I try to post more trades here and explain my thinking behind the trades.
Also, I really would like to hear if someone else is using natural logarithm in their trading.
I try to post them as pictures so you can see them without having to use the link when I get back home.
Well then I started to study the natural logarithm(e=2.272) and also added e^2 which is 7.389, but because it it so large number I moved the point by one to the left(0.739). Because I tried to find some information about it related to trading but found nothing I just had to brainstorm and test whatever came to my mind. I found out quite quickly that if fibo retrace drawn from last swing before turning point, it can predict the swing length pretty accurate. Of course if it is in a powerful trend, price can brake the 2.272 zone and continue lower, but it usually finds some balance before it does, so one is able to draw a new retracement to indicate the length.
I've only traded it with low timeframes and mostly with DAX and EUR/USD. I've had some real success with this and hope that some of you could share your take on natural logarithm and maybe have some ideas come up from my trading strategy.
https://www.tradingview.com/x/jRnvSDT7/
Here was the most recent trade from DAX. I use 0.272 line to get a confirmed entry signal and keep my hard SL under the last swing low. This provides a nice RR with pretty high win rate.
The thing here is to find the last completed "cycle" and try to find a move where to draw the retracement from. One need to take price action into account here. If the price rallies or drops to the 2.272 line its maybe better to wait for weakness or try to trade with the latest swing. Those other lines between 0.272 and 2.272 is just to help me move my SL when the trade moves towards the 2.272 area.
https://www.tradingview.com/x/ScyFyvAY/
Here is one example from EU 1D. I've developed a 'feel' where to drawn the fibo from, but the basic line is that it needs to be the last swing before turning and if there's pullbacks in the swing it is probably safer to use the pullback high/low as one point in the retracement.
https://www.tradingview.com/x/JjNfY4QC/
Here are some trades I ended up taking today. The last retracement drawn wasn't too clear so I ended up closing my position before price reached the 2.272 area. When price came to 1.739 area it formed a small head and shoulder and I decided to close the position when price came to test that 1.739 zone.
I hope you even understand something I'm trying to say here!
Please ask anything and I try to post more trades here and explain my thinking behind the trades.
Also, I really would like to hear if someone else is using natural logarithm in their trading.
I try to post them as pictures so you can see them without having to use the link when I get back home.