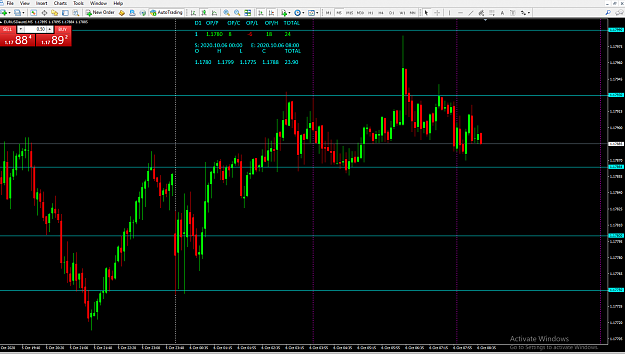
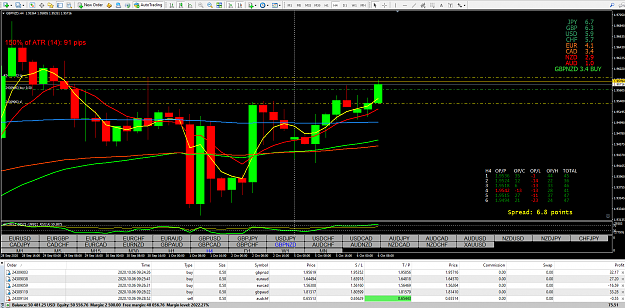
Disliked{quote} I got this far on the 4-hour chart but now I've hit a roadblock, OP/P Is the opening price on all time frames, OP/C is the opening of the PIPS price, OP/L is the opening showing how LOW the PIPS went, OP/H is the opening showing how HIGH the PIPS went, the fifth column is the total difference between the high and low of the timeframe, green is positive red is negative But then your description seems to be muddled up you say the second column will be the LOW of the timeframe, and the third column will be the high of the timeframe, at which...Ignored
Great, Very nice explanation with chart. My basic idea is this with this indi
1. we have 24 hours in a day - 0-4 / 4-8 / 8-12 / 12-16/ 16-20 / 20-24 that means 6 slots of 4 hours right
2. main trading hours where there is a pips movement is 8 -12 / 12-16 / 16-20
3. i try to gauge the strength of how much pips can be gained in that certain time period.
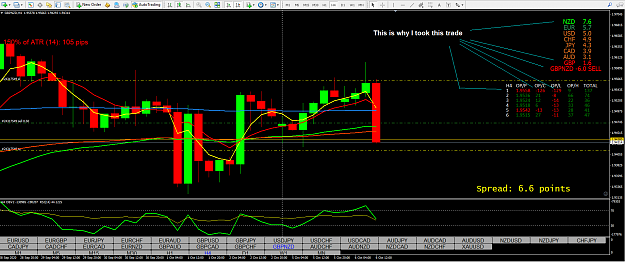
4. i place Forex Profit Supreme to gauge the currency strength if i am trading eurusd what is the euro power. This indi cross checks that this much pips have been gained now you can close the trade because all the euro strength has been utilized and all the usd pairs strength will bounce back
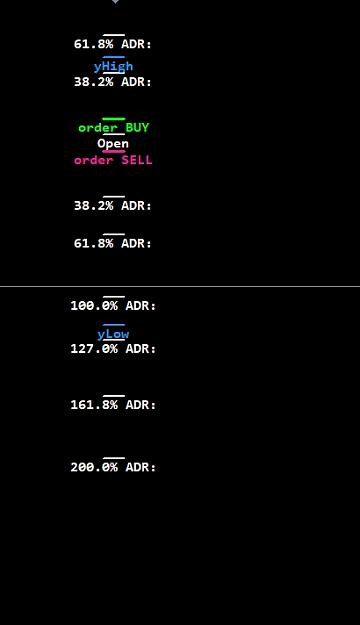
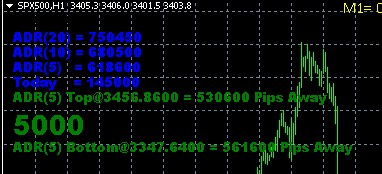
5. i also take the help of ADR. if i am in a Buy position of EURUSD when ADR reaches 50 % i cross check it with my indi the pips and with currency strength to stay in the trade or to exit.
This are the above points which helps me to trade better. Please also share your views and knowledge so we can also acquire the skills you have
and thank you for the indi. i will check and revert back
thanks & regards