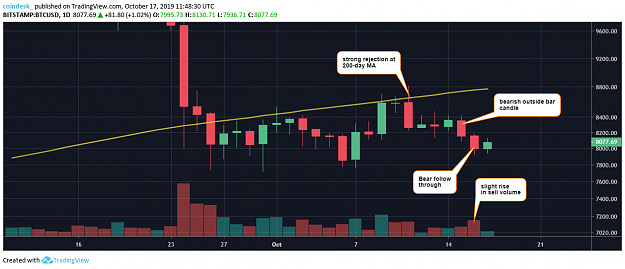
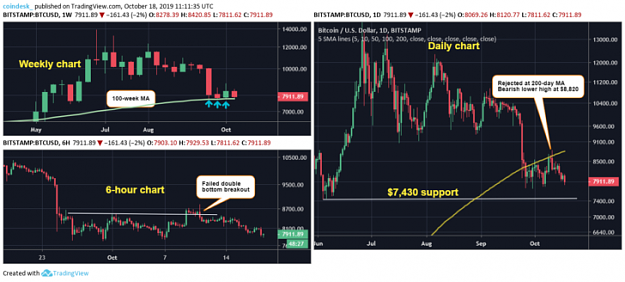
BTC remains on the defensive, having closed below $8,000 on Wednesday, bolstering the already bearish setup represented by Tuesday's outside bar candlestick pattern and Oct. 11's strong rejection at the 200-day average.
Bitcoin is up 1% after reaching a 24 hour low of $7,918 and 24 hour high of $8,117.
BTC remains on the hunt for a retest of recent lows near $7,750. The bearish case would weaken if prices rise above the 200-day average, currently located above 8,700.
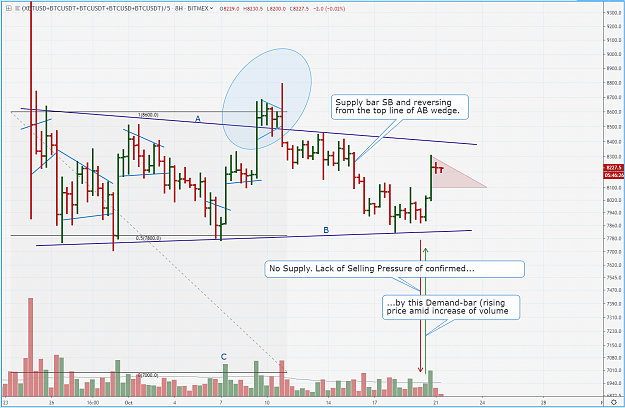
After a big distribution zone above 9300 (from 21/Jun till 24/Sep), #BTC market is producing movements like “2 steps down – 1 step up”. This is downtrend condition, and sell&hodl is the most reliable idea. When entering shorts?
find resistance
sell close to resistance (during test of resistance) and place SL above resistance.
Current chart shows how to find resistance. Look the volume&price. Find ND+SB confirmed pattern.
#ND is No_Demand with weak attempt to advance on exhausting volume
#SB (or SW) is Supply Pressure Bars/Waves – accelerating decline amid increase of volume.
Plot the Zone at these levels. It would be a rational RFSB – resistance from Supply Bar. Wait for test and join bearish team after confirmations on the faster TF (such as minor buying culminations / SLKT).
Oleg Alexandrov, market analyst. Find me in Google
8K support did not last long. Bulls are clearly exhausted as there is not substantial buying volume.
Ignored
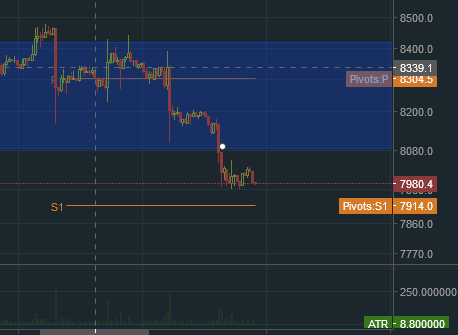
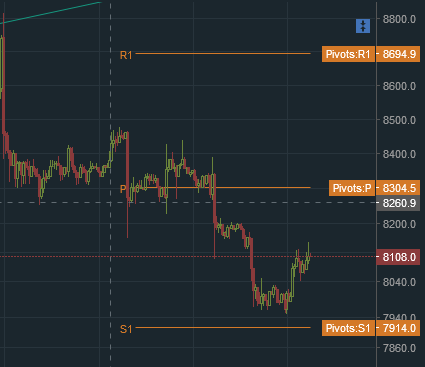
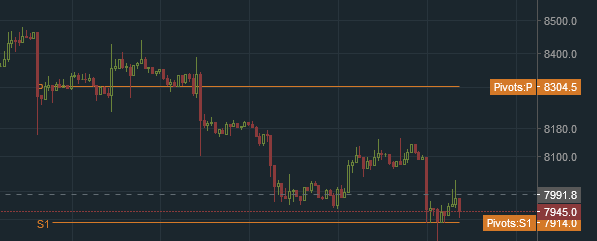
We're at some pivot support however, at S1. Might see a rally this weekend. The institutional shorters go home on the weekends, and us hodlers are propping 'er up!
AB balancing wedge is narrowing. The NS+DB sequence did show that #BTC was not ready to break down B. But this scenario remains valid as we have
Major zone of weakness above 9300 (from 21/Jun till 24/Sep)
Big SB 24/Sep
fake breakout (circled blue).
The recent up-bar with big volume looks like killing SLs above 8300. Note, we have minor SB on background. Many Sellers, who entered shorts on 15th/Oct, placed their SLs above 8300. Now they knocked out. If this interpretation true, we will see a building of a Shape of weakness (Red triangle) with a new attack on line B.
Be cautious, price is moving near the center of the wedge. This is why the market is vulnerable to send confusing signals.
Attached Image (click to enlarge)
Oleg Alexandrov, market analyst. Find me in Google
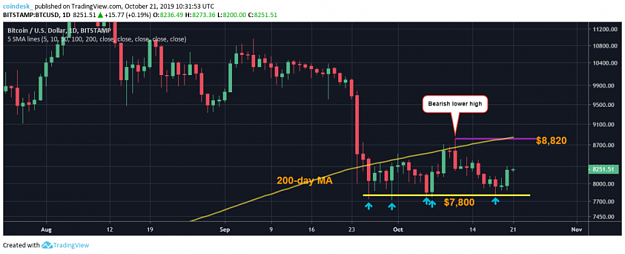
Bitcoin bounced up from $7,800 over the weekend neutralizing the immediate bearish setup. This was bitcoin's fifth defense of $7,800 since Sept. 26 and indicates seller exhaustion.
RSI are also showing early signs of a bullish reversal.
BTC is yet to invalidate the most basic of all bearish technical indicators – a lower high, lower low – with a move above Oct. 11's high of $8,820. That level could come into play as the hourly and 4-hour charts are reporting bullish conditions.
A daily close above $8,820 would confirm a bearish-to-bullish trend change. On the downside, $7,800 is the level to beat for the bears.
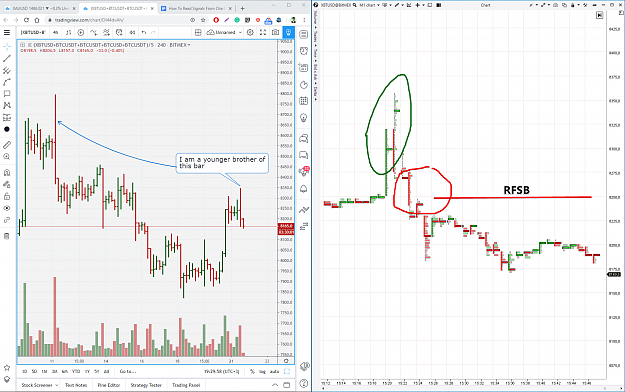
What are the inner workings behind this bar?
1) Green clusters - buyers are entering trap & sellers are knocking from their positions by Killing their SLs (SKLT)
2) Genuine supply enters the market and switches the direction down.
While the price is holding under 8250 RFSB - the situation is bearish. The nearest support 8100.
Attached Image (click to enlarge)
Oleg Alexandrov, market analyst. Find me in Google
I think we are at a key level right now, where BTC is testing levels around $8340 both yesterday and today. Let's see how the market takes those failed attempts!
SKLT trap happened on the BTCUSD market recently. What are the inner workings behind this bar? 1) Green clusters - buyers are entering trap & sellers are knocking from their positions by Killing their SLs (SKLT) 2) Genuine supply enters the market and switches the direction down. While the price is holding under 8250 RFSB - the situation is bearish. The nearest support 8100. {image}
Bitcoin bounced up from key Fibonacci retracement support of $7,850 neutralizing the immediate bearish setup, now a rally above the bearish lower high of $8,820 is needed to put the bulls in a commanding position.
That level could soon come into play soon as the 50-hour moving average (MA) has crossed above the 200-hour MA, confirming a golden crossover – a bullish setup.
The MA crossovers on the hourly and other short duration charts follow prices more closely and are thus more reliable as trend indicators as opposed to their daily and weekly chart counterparts, which lag price and often work as contrary indicators.
Backed by an above-50 print on the relative strength index (RSI), the golden cross has fueled the bullish setup, as represented by Monday's inverse head-and-shoulders breakout.
MACD reporting seller exhaustion on the three-day chart. The bullish case would weaken if prices fall back below $8,000, although as of now, that looks unlikely.
SKLT trap happened on the BTCUSD market recently. What are the inner workings behind this bar? 1) Green clusters - buyers are entering trap & sellers are knocking from their positions by Killing their SLs (SKLT) 2) Genuine supply enters the market and switches the direction down. While the price is holding under 8250 RFSB - the situation is bearish. The nearest support 8100. {image}
Ignored
On your left chart legend states that this is (XBTUSD + BTCUSDТ + BTCUSDT + BTCUSD + BTCUSDT) / 5 BITMEX
Only XBTUSD is traded on BITMEX (and it based on average price from three other exxchanges). So what exchanges are the other components of this average? And more important, what volume do you analyze? Is this total volume on all 5 exchanges (BTW, what 4 of them are) or just BITMEX?