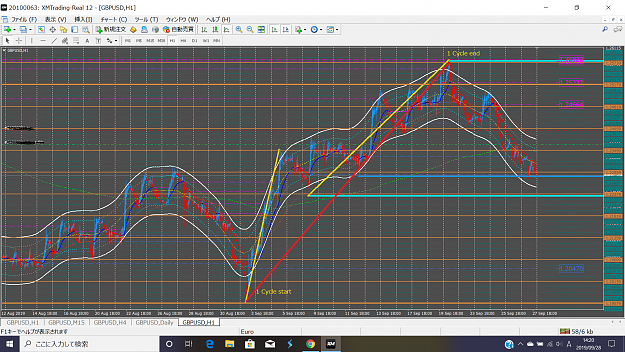
The thing is very simple, and I use it in the next programs for LazyOpen trader ...
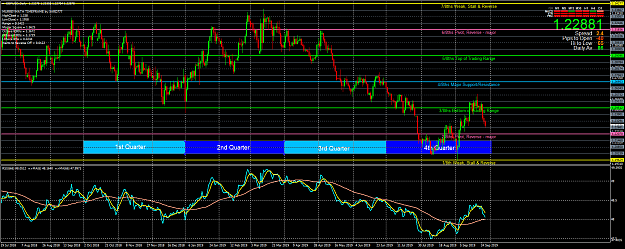
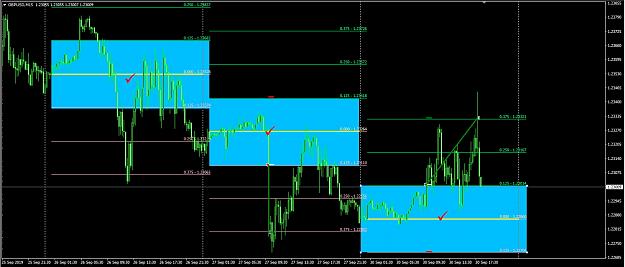
Follow in charts the sections where the two Hull averages have an identical trend. (In the chart I have set the price setting for the candles on Open).
If you count on these sections the number of green and red candles, you have a statistical advantage when you trade, for example, only green or only red candles from the Open.
Of course, there are fluctuations within the day and you will make some losses.
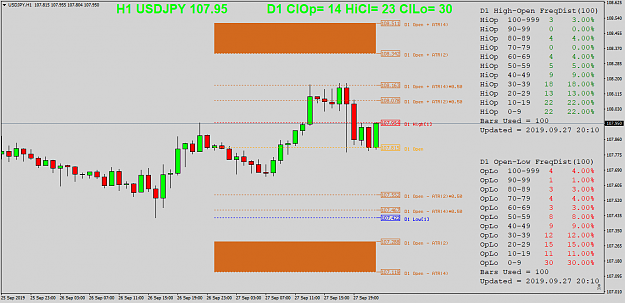
Example of an evaluation of long trades, as I did yesterday (AUDNZD and an other NZD pair I think):
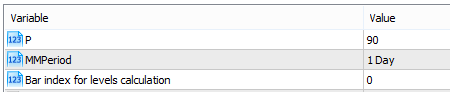
(Daily statistics, M15 trading).
With the values from the statistic one has the SL = Open/Low and the TP = Open/Close.
Generally the factor TP/SL = 2.4
You generally have the same number of wins and losses, for example 10/10 in about 30 days. (Entry at Open only if the two Hull averages have the same trend).
For a risc = 1% you gain 24% and you lose 10%, then you have 14% profit in 30 days, which equals about 10% per month.
Some pairs, such as EURUSD have worse results, and you can sort them out.
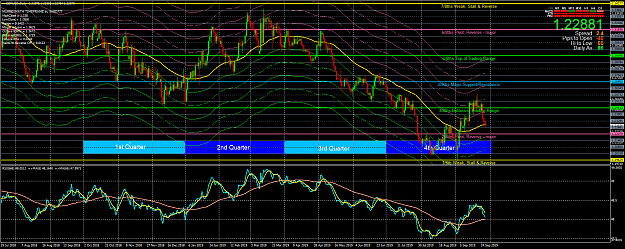
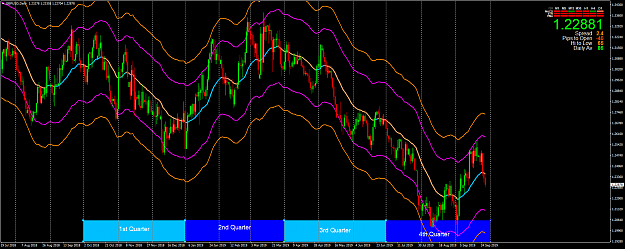
- Another filter would be the volatility, namely the distance of the two Hull averages! If the Hull(12) rises above the Hull(120), the candles will also be longer, and the odds of winning in this days are greater.
Please try to think about these ideas ...
I am working on an EA, but now I have some development problems.
Follow in charts the sections where the two Hull averages have an identical trend. (In the chart I have set the price setting for the candles on Open).
If you count on these sections the number of green and red candles, you have a statistical advantage when you trade, for example, only green or only red candles from the Open.
Of course, there are fluctuations within the day and you will make some losses.
Example of an evaluation of long trades, as I did yesterday (AUDNZD and an other NZD pair I think):
(Daily statistics, M15 trading).
With the values from the statistic one has the SL = Open/Low and the TP = Open/Close.
Generally the factor TP/SL = 2.4
You generally have the same number of wins and losses, for example 10/10 in about 30 days. (Entry at Open only if the two Hull averages have the same trend).
For a risc = 1% you gain 24% and you lose 10%, then you have 14% profit in 30 days, which equals about 10% per month.
Some pairs, such as EURUSD have worse results, and you can sort them out.
- Another filter would be the volatility, namely the distance of the two Hull averages! If the Hull(12) rises above the Hull(120), the candles will also be longer, and the odds of winning in this days are greater.
Please try to think about these ideas ...
I am working on an EA, but now I have some development problems.
2