I have the bare bones of a strategy, and thought I would post the IDEA here.
This is open for everyone to contribute to and there is plenty of room for open critique. After all, everything is really, really easy in hindsight. This is not my TE, but I am hoping that if there is a good discussion here that it cold slot into and help filter out some bad trades, and lead to some proper trades.
However. There are some Rules to this thread so take heed.
1) Images MUST follow the template.
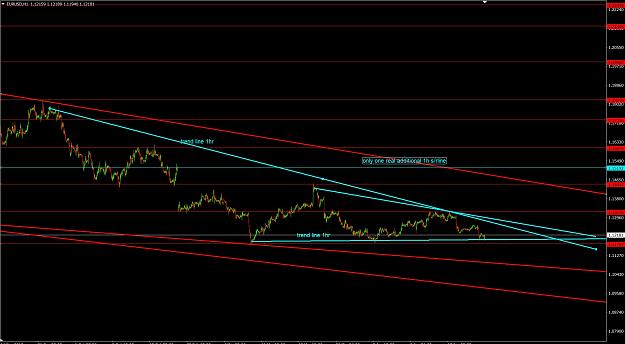
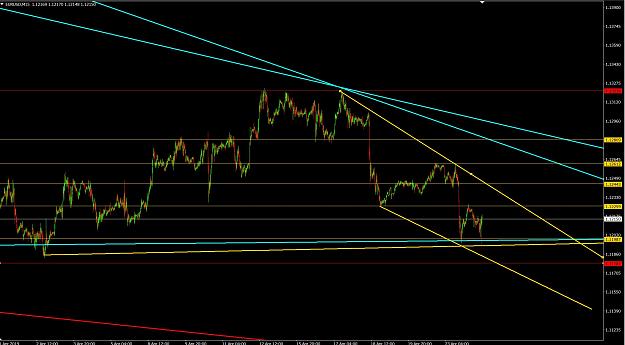
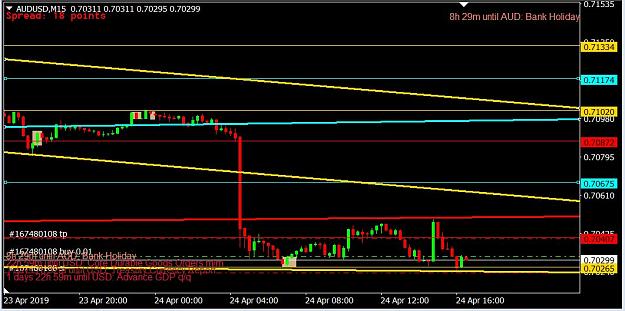
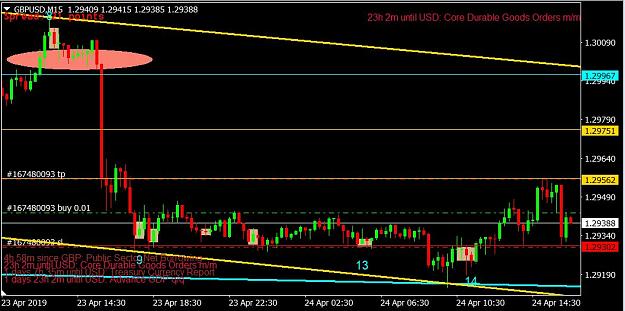
2) Images MUST contain 4hr in red, 1hr in Aqua and 15 min in Gold- This is so EVERYONE can see the same thing and it is easy to interpret. The colours are chosen because they are easy to type into the properties section to change the colour of the trend and S/R lines. This is a practical reason as well as a visual 'all on the same wavelength' reason.
3) No berating others.
4) I am not an expert. I take criticism as long as it is constructive. The idea is that we learn together.
5) This is subject to change, this is about growing
6) ANY image MUST show reasoning. Posting a chart without explanation is pointless
7) exception to number 6... is when you are looking for clarification... have I put S/R in the right place, are my trend lines correct, is this an OB, IB, Engulfing, Doji, Pin bar... not that these are (at the time of writing) important, but they could well fall into this study - they are not important fat the offset.
8) IF YOU POST TRADES, IT HAS TO BE WHEN YOU OPEN THE TRADE, NOT AFTER. THAT IS NOT IMPROTANT - IT BECOMES A BACK TEST
9) IF YOU POST A TRADE, YOU HAVE TO POST THE RESULT. HOW YOU MANAGED THE TRDAE AS WELL.
These last two rules are vitally important
Overview of the study:
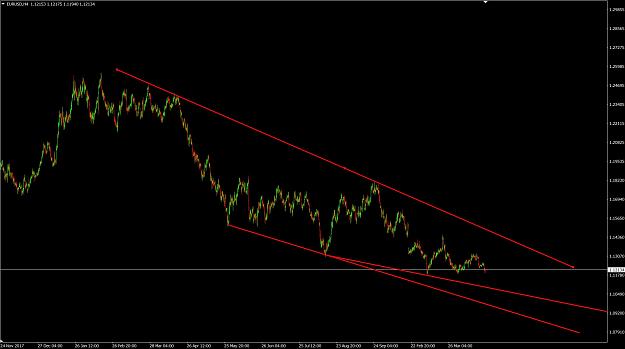
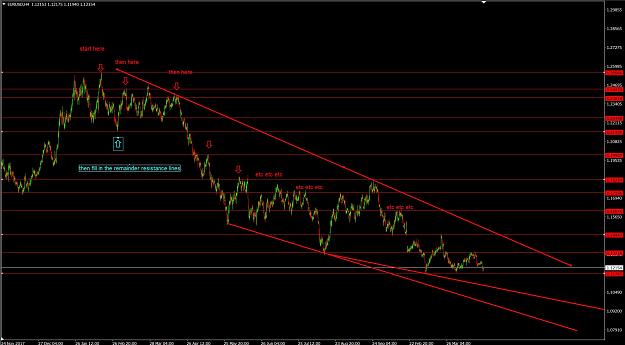
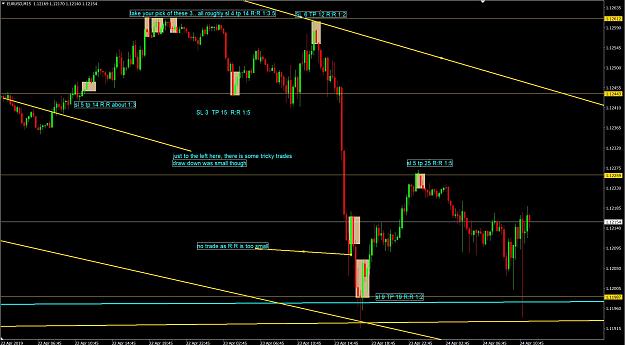
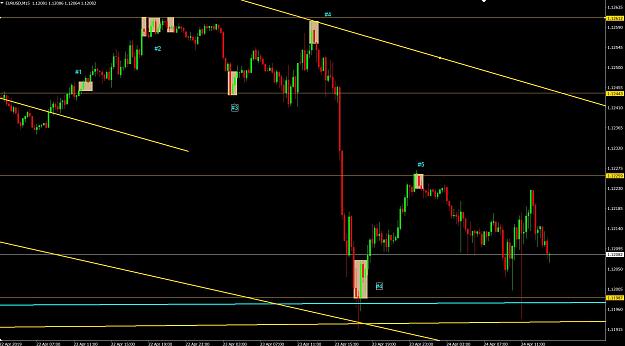
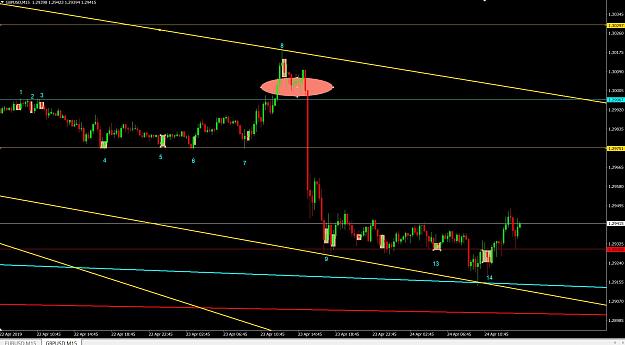
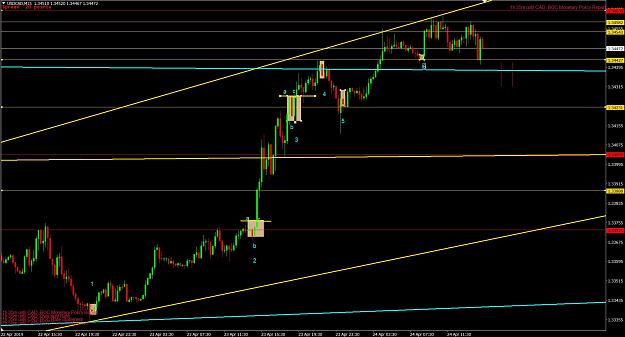
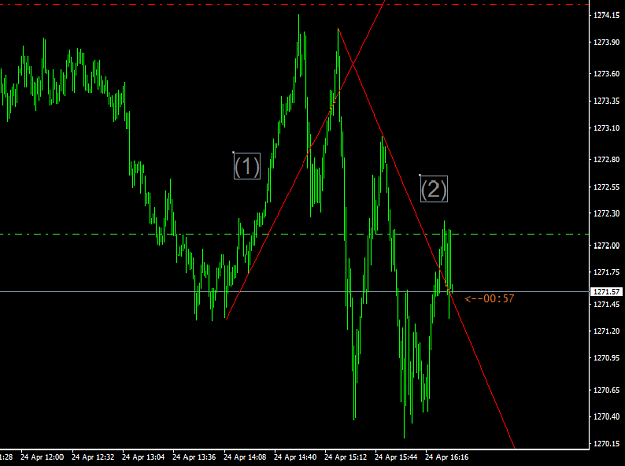
The basic premise is that price reacts around s/r and trend lines. Knowing where to put these, and when to trade off them is the biggest issue.
I am going to present in a series of images how I draw these in and show where I would take the trades, and how I would take the trades. These are for illustrative purposes only. EVERYTHING is easy when you look back and say, this is where I would take them, and where I would not. I am not hiding this fact. The purpose of the study is to FORWARD test. I invite EVERYONE who wants to, to open up a demo account of only $500 (rationale will be explained later) and help me forward test the study, and to improve and whittle it down.
You may agree, or disagree with this, and that is absolutely fine. If you are against this idea, I ask that you still take part in the study and test it out. I am not saying that this is correct, but I am saying that there is some spooky things that happen around these areas that can lead to some fantastic R:R trades (at the moment in hindsight, hopefully this study will forward test these)
I am not against the idea of using indicators to filter out trades, but this is not part of the study - at the moment. If you want to propose an idea, then please feel free and BACK IT UP with examples. We can always add it to the study.
All trades are taken off the 15 minutes chart, although I think this could be modified to the 30 min or 1 hour charts if needed, I have not looked at this, but in theory, this should work just as well.
Trade management (for me)
I MUST have a SL and TP. When a trade goes to 50% profit, I change to a BE trade. That is just me- trade management is an area where we need to test and test some more. SL are movable - ie, you could just say that the SL is static, 5 pips for instance, or you can put beneath/above S/R lines, or at Structure. (the S/R lines are at points of structure in any case) or above/below wicks of the nearest candle. It all depends on risk.
UPDATE - Template added
UPDATE 2 - Template updated with indicators (spread and news) Very useful! Also added the two indicators I always have on my charts.
This is open for everyone to contribute to and there is plenty of room for open critique. After all, everything is really, really easy in hindsight. This is not my TE, but I am hoping that if there is a good discussion here that it cold slot into and help filter out some bad trades, and lead to some proper trades.
However. There are some Rules to this thread so take heed.
1) Images MUST follow the template.
2) Images MUST contain 4hr in red, 1hr in Aqua and 15 min in Gold- This is so EVERYONE can see the same thing and it is easy to interpret. The colours are chosen because they are easy to type into the properties section to change the colour of the trend and S/R lines. This is a practical reason as well as a visual 'all on the same wavelength' reason.
3) No berating others.
4) I am not an expert. I take criticism as long as it is constructive. The idea is that we learn together.
5) This is subject to change, this is about growing
6) ANY image MUST show reasoning. Posting a chart without explanation is pointless
7) exception to number 6... is when you are looking for clarification... have I put S/R in the right place, are my trend lines correct, is this an OB, IB, Engulfing, Doji, Pin bar... not that these are (at the time of writing) important, but they could well fall into this study - they are not important fat the offset.
8) IF YOU POST TRADES, IT HAS TO BE WHEN YOU OPEN THE TRADE, NOT AFTER. THAT IS NOT IMPROTANT - IT BECOMES A BACK TEST
9) IF YOU POST A TRADE, YOU HAVE TO POST THE RESULT. HOW YOU MANAGED THE TRDAE AS WELL.
These last two rules are vitally important
Overview of the study:
The basic premise is that price reacts around s/r and trend lines. Knowing where to put these, and when to trade off them is the biggest issue.
I am going to present in a series of images how I draw these in and show where I would take the trades, and how I would take the trades. These are for illustrative purposes only. EVERYTHING is easy when you look back and say, this is where I would take them, and where I would not. I am not hiding this fact. The purpose of the study is to FORWARD test. I invite EVERYONE who wants to, to open up a demo account of only $500 (rationale will be explained later) and help me forward test the study, and to improve and whittle it down.
You may agree, or disagree with this, and that is absolutely fine. If you are against this idea, I ask that you still take part in the study and test it out. I am not saying that this is correct, but I am saying that there is some spooky things that happen around these areas that can lead to some fantastic R:R trades (at the moment in hindsight, hopefully this study will forward test these)
I am not against the idea of using indicators to filter out trades, but this is not part of the study - at the moment. If you want to propose an idea, then please feel free and BACK IT UP with examples. We can always add it to the study.
All trades are taken off the 15 minutes chart, although I think this could be modified to the 30 min or 1 hour charts if needed, I have not looked at this, but in theory, this should work just as well.
Trade management (for me)
I MUST have a SL and TP. When a trade goes to 50% profit, I change to a BE trade. That is just me- trade management is an area where we need to test and test some more. SL are movable - ie, you could just say that the SL is static, 5 pips for instance, or you can put beneath/above S/R lines, or at Structure. (the S/R lines are at points of structure in any case) or above/below wicks of the nearest candle. It all depends on risk.
UPDATE - Template added
UPDATE 2 - Template updated with indicators (spread and news) Very useful! Also added the two indicators I always have on my charts.
Attached File(s)
Attached File(s)
Attached File(s)