I've been a follower of the TMS method - which I found profitable, if following the original instructions from Eelfranz. I was also looking for a way to help me monitor my charts better and filter the bad signals. So I made this indicator from pieces (from other indis). I'm no coder but lucky me, it works.
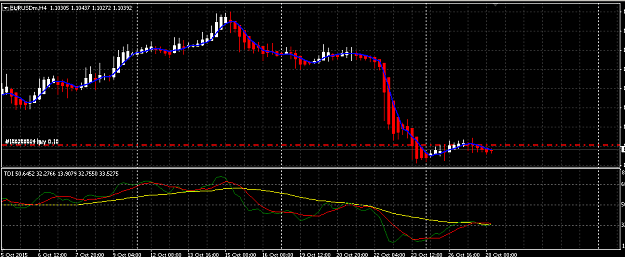
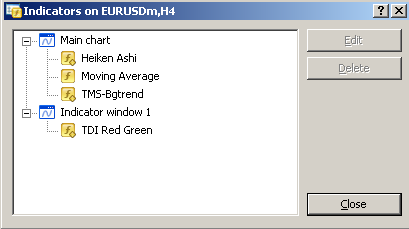
However, it needs more modifications. What it does now is to detect the momentum on D1 timeframe (based on TDI and Heiken Ashi), and the Stochastic signals on current timeframe. And it changes the background color according to those signals.
So, for example, it changes the color to green when all the following conditions are met:
- HA D1 candle is green
- HA current timeframe is green
- price closed above the 5 SMA
- TDI D1 green > red
... and changes to pink on the opposite signals. If these signals don't match, nothing happens.
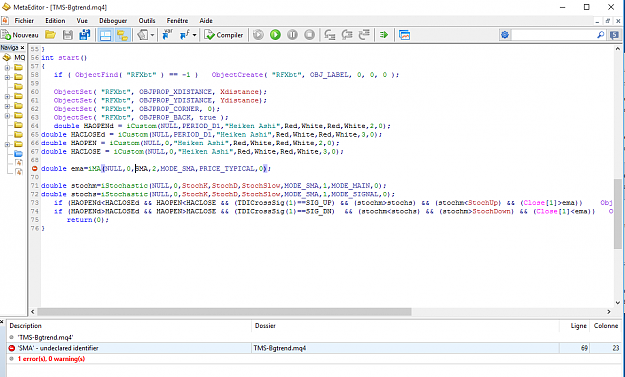
Now, if you're a TDI trader or if you like the TMS method and you have some coding skills, please help develop this further. I want to add one more condition for the chart to change color and I don't know how. I want to change the color to green if the TDI red/green lines are above the market line - and vice-versa for pink (sell). This will further filter the bad trades, I believe. And I don't care about the green crossing red, only their relation with the market line. Something like that
- if TDI (green>yellow) && (red>yellow) than background color = green

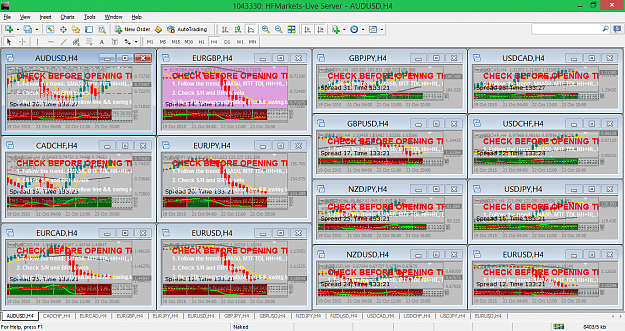
Anyway, this is how it helps me monitoring my charts. Only one chart has a color, so only one chart worth checking. Easy job, now close the computer and come back after another 4 hours ![]()
Below is the indicator, working as described above. Hopefully someone else will improve it. Take it, use it, modify it if you wish.
Just in case somebody will get this wrong: THIS IS NOT A TRADING SYSTEM. THE INDICATOR WAS NOT DESIGNED TO GIVE ENTRY SIGNALS. I ONLY USE IT TO EASE MY TRADING USING THE TDI AND THE HEIKEN ASHI, AS IN THE TMS THREAD.