Hello.
The Dashboard RSI Multicurrency indicator for MT4 & MT5.
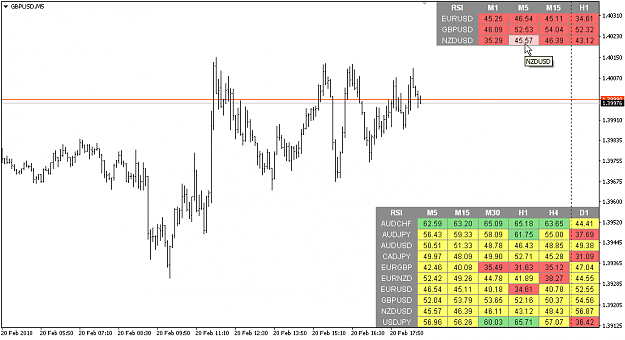
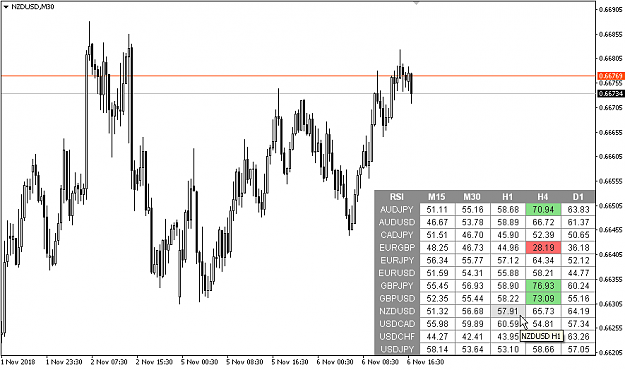
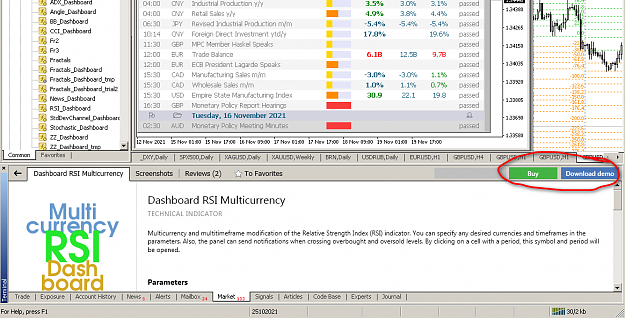
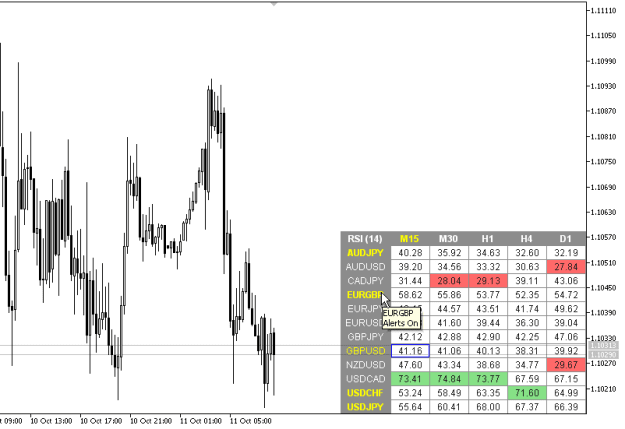
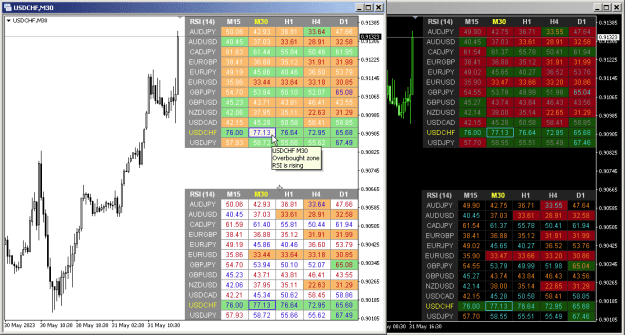
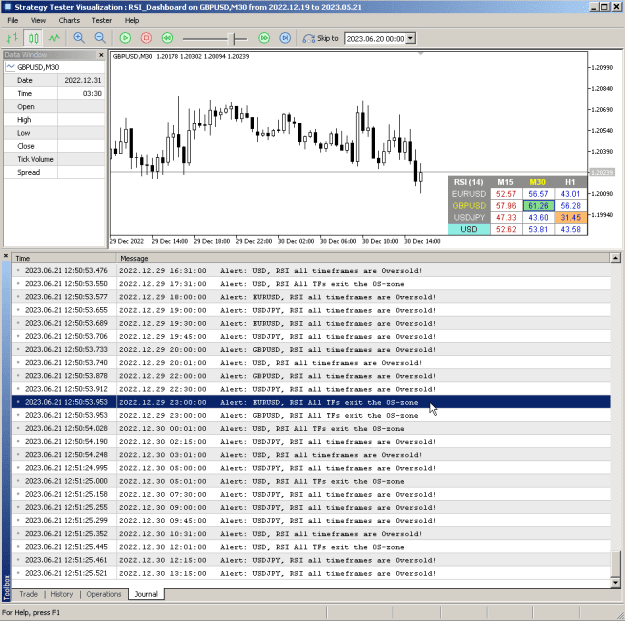
Multicurrency and multitimeframe modification of the Relative Strength Index (RSI) indicator. You can specify any desired currencies and timeframes in the parameters. Also, the indicator can send notifications when crossing overbought and oversold levels. By clicking on a cell with a period, this symbol and period will be opened. This is MTF Scanner.
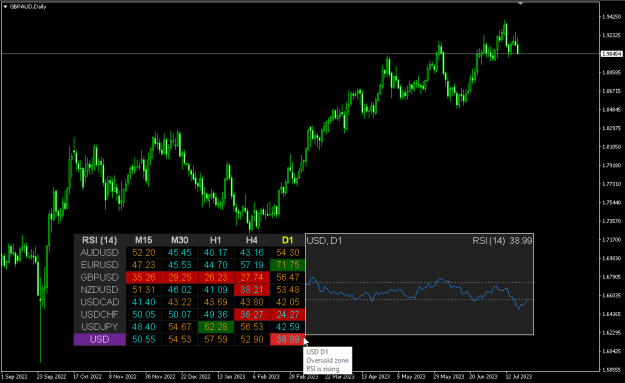
Similar to the Currency Strenghth Meter, the Dashboard can automatically select pairs containing the specified Currency or those pairs that have this Currency as the base. The indicator will also calculate the RSI for this Currency on a separate line.
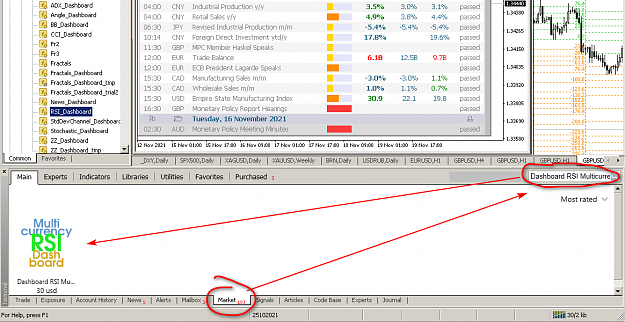
Demo version you can download directly from MT4 (MT5), from the Market tab. And you can try it in the strategy tester, in the visual mode.
Video with indicator capabilities:
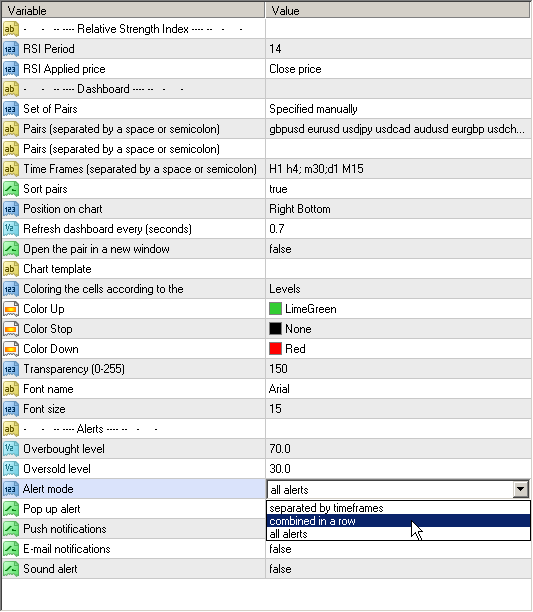
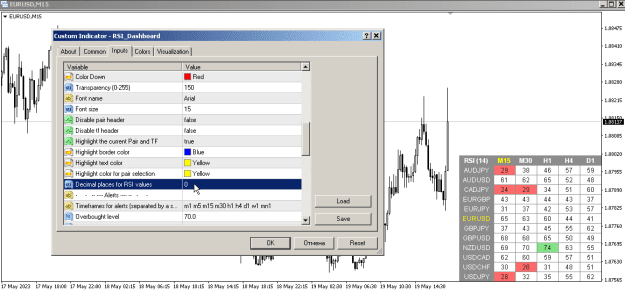
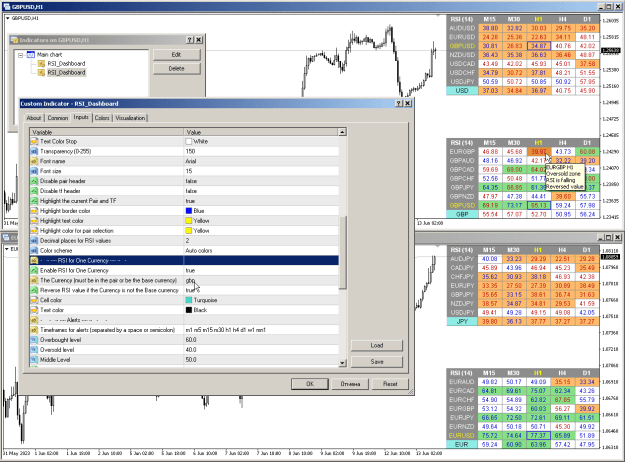
Parameters 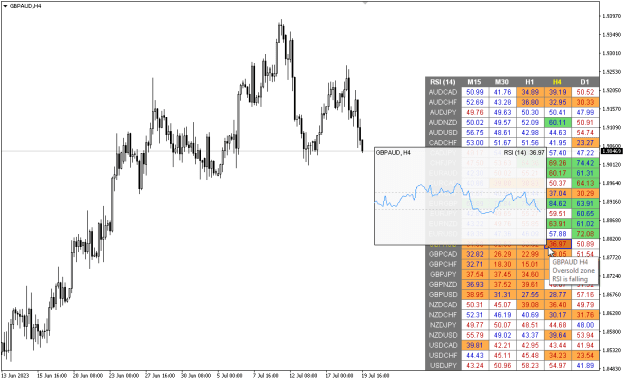

The Dashboard RSI Multicurrency indicator for MT4 & MT5.
Multicurrency and multitimeframe modification of the Relative Strength Index (RSI) indicator. You can specify any desired currencies and timeframes in the parameters. Also, the indicator can send notifications when crossing overbought and oversold levels. By clicking on a cell with a period, this symbol and period will be opened. This is MTF Scanner.
Similar to the Currency Strenghth Meter, the Dashboard can automatically select pairs containing the specified Currency or those pairs that have this Currency as the base. The indicator will also calculate the RSI for this Currency on a separate line.
Demo version you can download directly from MT4 (MT5), from the Market tab. And you can try it in the strategy tester, in the visual mode.
Video with indicator capabilities:
Inserted Video
Parameters
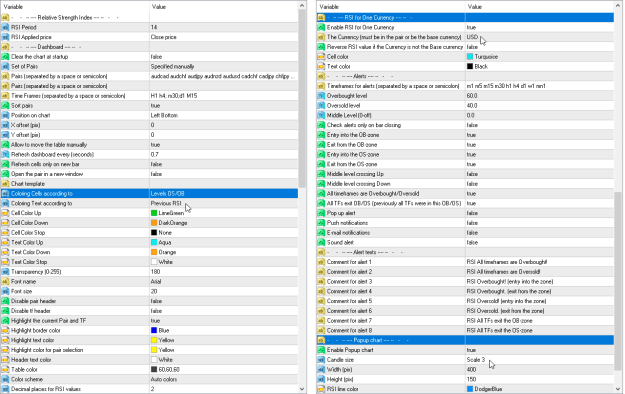
- RSI Period — averaging period.
- RSI Applied price — price type.
- Clear the chart at startup — clear the chart at startup.
- Set of Pairs — set of symbols
- Market Watch — pairs from the "Market Watch";
- Specified manually — pairs specified manually, in the parameters "Pairs".
- Pairs (separated by a space or semicolon) — list of symbols separated by spaces or semicolons. The currency names should be written exactly like the broker's, keeping the case and prefix/suffix.
- Time Frames (separated by a space or semicolon) — list of timeframes separated by spaces or semicolons.
- Sort pairs — sorting the list of pairs.
- Position on chart — corner to display the panel on the chart.
- X offset (pix) — shift the panel along the X axis;
- Y offset (pix) — shift the panel along the Y axis;
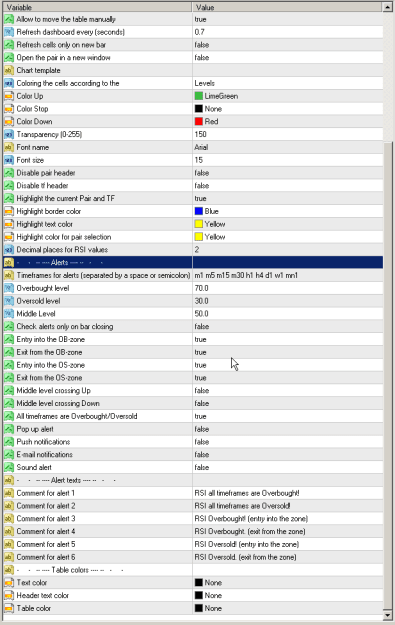
- Refresh dashboard every (seconds) — update period for all pairs and timeframes.
- Refresh cells only on new bar — cell updates (and alerts) will only occur when a new bar appears.
- Open the pair in a new window — open a symbol in a new chart window by clicking.
- Chart template — the name of the template for the chart, if the chart opens in a new window.
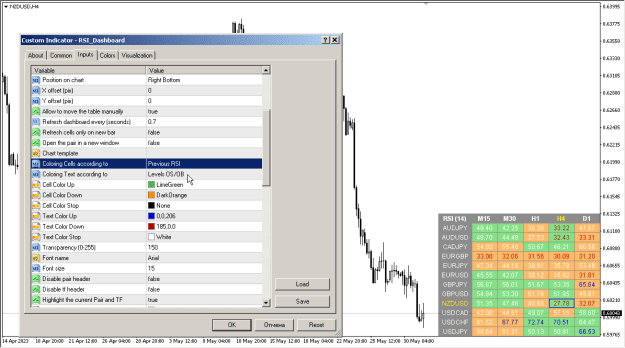
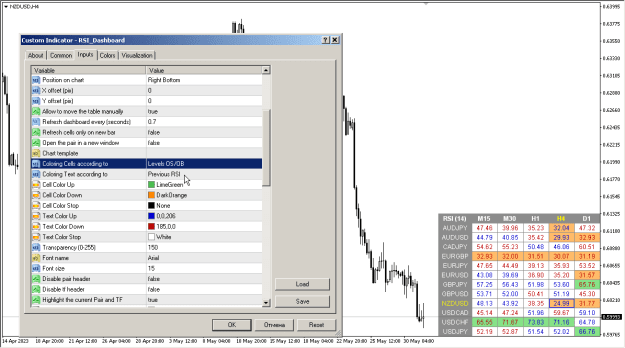
- Coloring the cells according to the —paint the cells of the table according to the levels of overbought/oversold or according to the direction of the previous candle.
- Color Up — cell color if the indicator increases.
- Color Down — cell color if the indicator decreases.
- Color Stop — cell color if the indicator does not change.
- Transparency (0-255) — transparency of the panel.
- Font name — font name.
- Font size — font size.
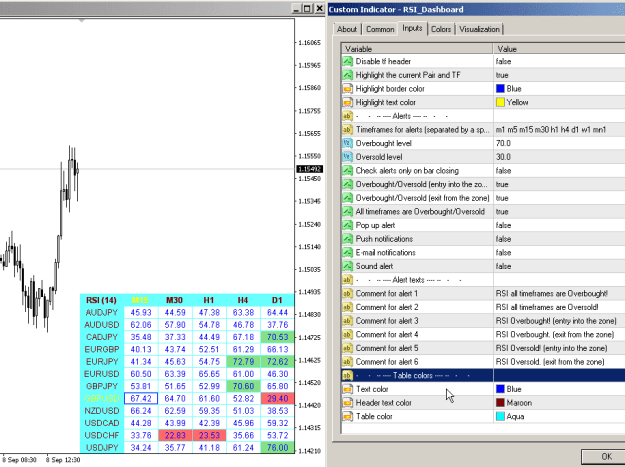
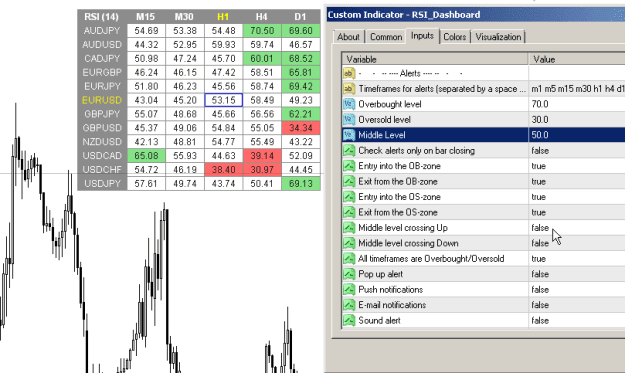
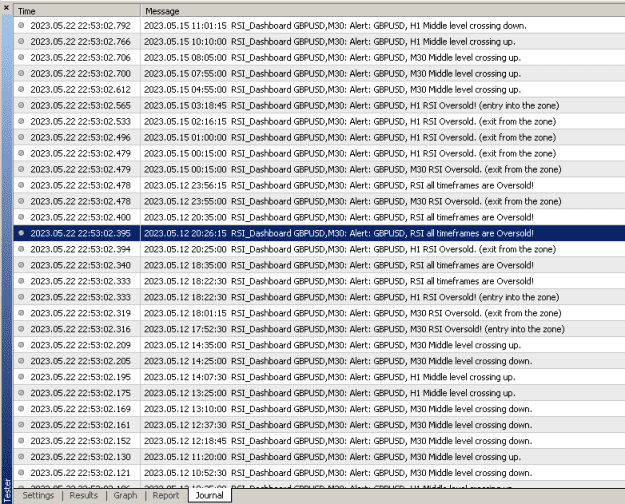
- Timeframes for alerts (separated by a space or semicolon) — list of periods for which the alert will be sent (separated by a space or semicolon).
- Overbought level — overbought level for alerts.
- Oversold level — oversold level for alerts.
- Check alerts only on bar closing — check level crossing only after bar closing.
- Pop up alert — pop-up alert.
- Push notifications — push notification.
- E-mail notifications — e-mail notification.
- Sound alert — sound alert.
Some pictures:
Attached Image (click to enlarge)
Attached Image (click to enlarge)
Attached Image (click to enlarge)
Attached Image (click to enlarge)
Attached Image (click to enlarge)
Attached Image (click to enlarge)
Attached Image (click to enlarge)