Hi!
First of all sorry for my English. I've come up with an idea, which I have used it with a live account an I've had interesting results (although those accounts blew up later because of lack of proper MM).
So I was thinking about the price action and that it has to be a way to make some money with no or minimum of efforts. then as I was watching the charts I saw something! (Go and check it out your selves) Everyone knows that the price can go up, down and sideways.
We don't know when will a trend start and we don't know how long does it gonna last. We only know one thing. price will go up or down. But did you ever counted the candles?? At a point the candles in one direction are going to be more than on the other direction. The problem is that we don't know which direction to take....so I started on both directions on m5 chart (later I blew up this account but I've had crazy results!) I've placed every 5min trades on both directions (I know what you thinkin' ) One direction went up (in profit) the other went down (creating minus). At point I closed all my trades in the direction of the trend (usually all in profits) but I was left there with the loosing side...In the snapshot above lets pretend that the long trade were all closed with a profit but my sell trades were at a big minus BUT(!) beause I allways opened a new trade every 5min, eventually when the price started to go sideways, then later we got to an oposit trend, I could close all of the sell trades in profit! And only because when it started to go sideways, at that range there were so much trades opened that when it started to go in my favour, those trades made me enough money to get out in profit although there were a lot of negative trades opened!
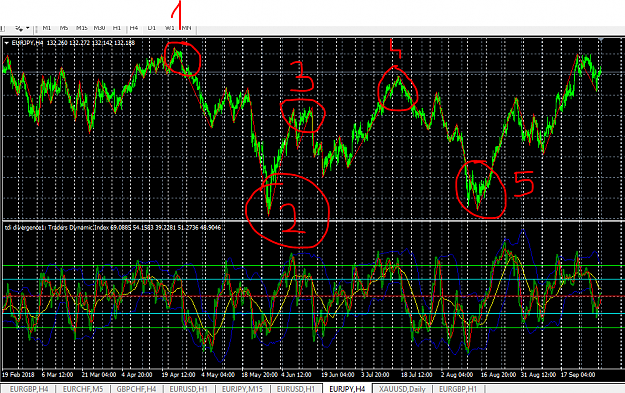
I hope all of you understand what I'm trying to tell you. Scroll to any timeline, any pairs and you will see that if you start at the wrong side of the trend and if you open a new order every time you get a new candle eventually you can come out of every loosing trade win big wins (because of the zig-zag movement of the price)! My account was at 100eu (micro account = 10 000eu cent)when I started this kind of trading an went up to 3500eu in a few months with an average of 80% profit every month (worst was 20% best was 130%)! With a leverage of 1:100 and a minimum of 0,1lots (I know, I was lucky at the beginning). When I passed 200eu, I started 0,2 and so on. I was doing everything manually. It was hard. And because I couldn't watch the chart every 5min. I didn't got out when I should have, and later my account blew up on me (becuse my account was to little)...Later I was trying to understand what happened and what position size could be best for this strategy. So I started another round with this method. Again 100eu (micro account = 10 000eu cent), again 1:100, and again with 0,1 lot. Now I was on the 1h chart, and it was better. I got to 300eu in about 3months with maintainin the 0,1lot size, BUT I got screwed again because of not looking at the charts every hour...
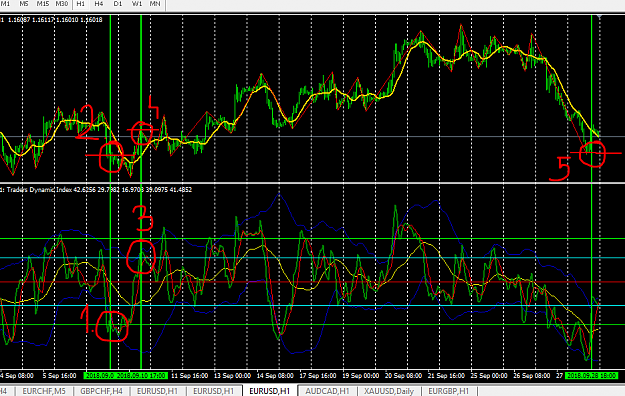
So lets see a real example of this strategy (1. screenshot). After this please go and research at any timeframe and at any pairs!
HOW TO ENTER:
I use TDI indicator but can be replaced with RSI also.
1. When te green line in the TDI indicator gets under the 32.00 line and later goes over it, that's the entrypoint. We start to place buy and sell order at the same time. We put every hour (this is the 1h chart) a buy and a sell order!
2. The red line shows us where are we gonna start.
3.When the green line of the TDI indicator goes over the 60.00 blue line, that's where we close all the buy orders in profit.
4. The red line is the place where we close all the buy orders.
Now let assume that we didn't had the time to look at our charts, but an EA put every hour a new sell order....
5. At this position we could have closed all our sell orders with a huge profit!
----------
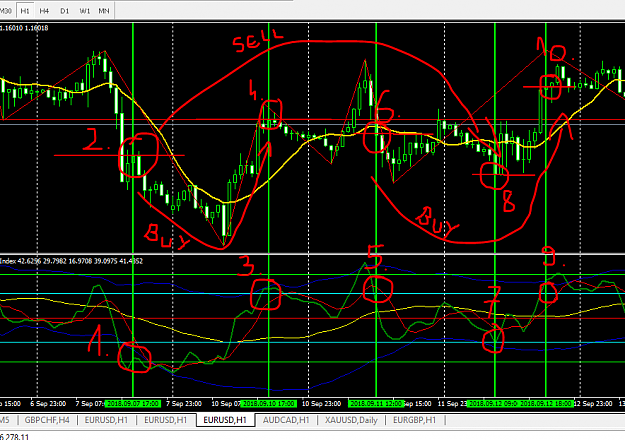
Now lets assume that we were able to check our account ever hour. (the 2. screenshot looks complicated but its not! )
ENTER:
1.We have a signal. We enter for both sides.
2.We enter at that level.
3.We close all the buys.
4. We closed all the buys at that level.
5.We got a new signal and because we have sell orders already opened, we go for a new round of buy orders.
6.From this level we start to put again buy orders also.
7.this is the signal for the sell orders to be closed IF they are in profit (if they are stil not in profit, we will wait for another signal, where we can check for a close)
8. this is the level where the sell orders are closed. (draw a line there. every sell trade above are in profit, every sell orders under the line are in loss)
9. we have a signal for long orders to be closed.
10. this is the level where we closed all long trades. (Check out where we started the longs and where we ended them)
Check out the 2-4 etry and exit lines for buy; 2-8 entry lines for sell;6-10 for buy
----------------
So if you do your backtesting you will find out that this strategy works 100%....now the problems...1.we need to put all this to an EA....2. We need to come up with a plan for proper MM. If you're thinking about stop loss, than that's a wrong idea for this strategy... I was thinking on something like taking out every profit every month (because of the big win%), and putting it aside (if the account will gets whipped out again we still have cash to carry on), or if someone has a system for really big trends, that doesn't work on smaller trends or when the price is ranging and combining these two strategies. Or maybe some skalping strategy that can be combined with this (for making a basket when things start to go out of hands). Lets put our minds together and lets make this strategy work for us!
First of all sorry for my English. I've come up with an idea, which I have used it with a live account an I've had interesting results (although those accounts blew up later because of lack of proper MM).
So I was thinking about the price action and that it has to be a way to make some money with no or minimum of efforts. then as I was watching the charts I saw something! (Go and check it out your selves) Everyone knows that the price can go up, down and sideways.
We don't know when will a trend start and we don't know how long does it gonna last. We only know one thing. price will go up or down. But did you ever counted the candles?? At a point the candles in one direction are going to be more than on the other direction. The problem is that we don't know which direction to take....so I started on both directions on m5 chart (later I blew up this account but I've had crazy results!) I've placed every 5min trades on both directions (I know what you thinkin'
I hope all of you understand what I'm trying to tell you. Scroll to any timeline, any pairs and you will see that if you start at the wrong side of the trend and if you open a new order every time you get a new candle eventually you can come out of every loosing trade win big wins (because of the zig-zag movement of the price)! My account was at 100eu (micro account = 10 000eu cent)when I started this kind of trading an went up to 3500eu in a few months with an average of 80% profit every month (worst was 20% best was 130%)! With a leverage of 1:100 and a minimum of 0,1lots (I know, I was lucky at the beginning). When I passed 200eu, I started 0,2 and so on. I was doing everything manually. It was hard. And because I couldn't watch the chart every 5min. I didn't got out when I should have, and later my account blew up on me (becuse my account was to little)...Later I was trying to understand what happened and what position size could be best for this strategy. So I started another round with this method. Again 100eu (micro account = 10 000eu cent), again 1:100, and again with 0,1 lot. Now I was on the 1h chart, and it was better. I got to 300eu in about 3months with maintainin the 0,1lot size, BUT I got screwed again because of not looking at the charts every hour...
So lets see a real example of this strategy (1. screenshot). After this please go and research at any timeframe and at any pairs!
HOW TO ENTER:
I use TDI indicator but can be replaced with RSI also.
1. When te green line in the TDI indicator gets under the 32.00 line and later goes over it, that's the entrypoint. We start to place buy and sell order at the same time. We put every hour (this is the 1h chart) a buy and a sell order!
2. The red line shows us where are we gonna start.
3.When the green line of the TDI indicator goes over the 60.00 blue line, that's where we close all the buy orders in profit.
4. The red line is the place where we close all the buy orders.
Now let assume that we didn't had the time to look at our charts, but an EA put every hour a new sell order....
5. At this position we could have closed all our sell orders with a huge profit!
----------
Now lets assume that we were able to check our account ever hour. (the 2. screenshot looks complicated but its not!
ENTER:
1.We have a signal. We enter for both sides.
2.We enter at that level.
3.We close all the buys.
4. We closed all the buys at that level.
5.We got a new signal and because we have sell orders already opened, we go for a new round of buy orders.
6.From this level we start to put again buy orders also.
7.this is the signal for the sell orders to be closed IF they are in profit (if they are stil not in profit, we will wait for another signal, where we can check for a close)
8. this is the level where the sell orders are closed. (draw a line there. every sell trade above are in profit, every sell orders under the line are in loss)
9. we have a signal for long orders to be closed.
10. this is the level where we closed all long trades. (Check out where we started the longs and where we ended them)
Check out the 2-4 etry and exit lines for buy; 2-8 entry lines for sell;6-10 for buy
----------------
So if you do your backtesting you will find out that this strategy works 100%....now the problems...1.we need to put all this to an EA....2. We need to come up with a plan for proper MM. If you're thinking about stop loss, than that's a wrong idea for this strategy... I was thinking on something like taking out every profit every month (because of the big win%), and putting it aside (if the account will gets whipped out again we still have cash to carry on), or if someone has a system for really big trends, that doesn't work on smaller trends or when the price is ranging and combining these two strategies. Or maybe some skalping strategy that can be combined with this (for making a basket when things start to go out of hands). Lets put our minds together and lets make this strategy work for us!
Attached Image(s) (click to enlarge)