The Method:
In order to know if a system works or not, one has to define it clearly, in advance, and when ready, trade it carefully for a defined period of time and without departing from the defined rules. Then investigate whether the inner mechanics of that system are safe or not, and according to the results eventually correct or improve it.
This is nothing else than the scientific method:
1. Problem =>.........Detect a new trend in order to trade it => Surf the wave when you see it.
2. Hypothesis =>......A trend, like a wave has its own duration and we want to trade in its direction for a maximum
...........................amount of time. For that, we have to enter the earlier possible and stay with it as long as the trend...........................remains valid. A trend is detected when the current price is higher (for an up trend),
...........................or lower (for a down trend) than its recent historical value => Surf the wave the longer you can
................ ..........but it's OK to swim from time to time and even more...
3. Experiment =>......Put the hypothesis at work by performing real trades => Stop talking and go surfing...
4. Data =>............Collect and analyze the results in a journal => Watch the videos and have fun...
5. Improve/Correct =>.Keep what works, remove what doesn’t, add new ideas and go to point 3 => Improve your surf...
As a trader, I have identified 2 jobs and goals for me:
1. To use this method with the goal of determining if my system works or not.
2. To respect the trading rules in any circumstance as not doing so would invalidate the first goal.
The System:
This is a journal where I want to record my trades and performances so I’m voluntarily not exposing the entirety of my system here. That being said, I can give a word about its general mechanics so maybe you get some inspiration from them but as you will see, there is nothing new here, this is just trend following in its purest form.
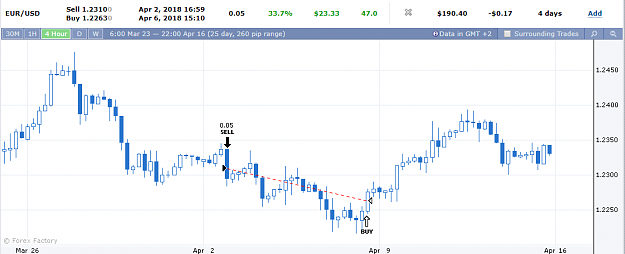
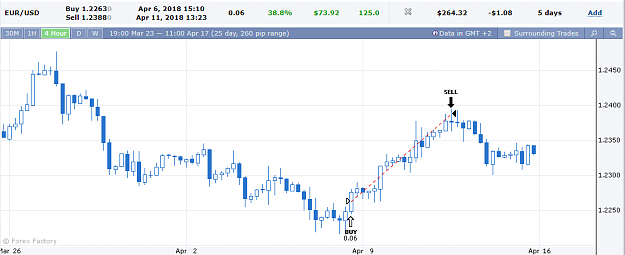
- How to detect a new trend and enter a trade.
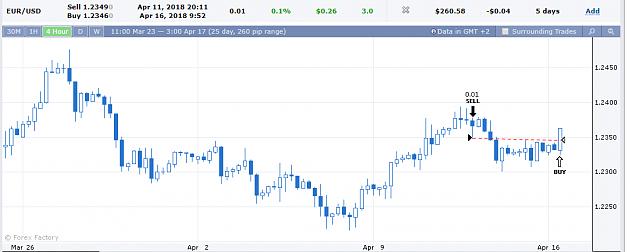
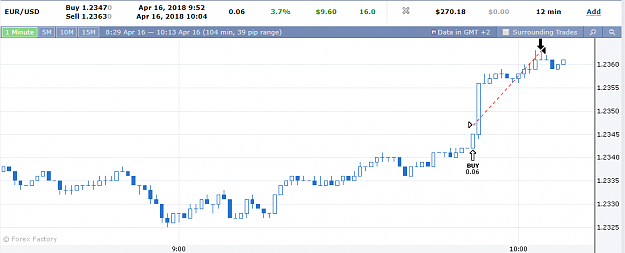
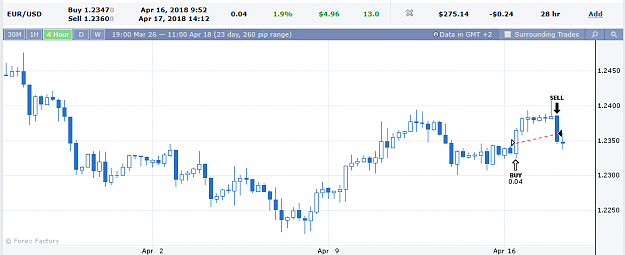
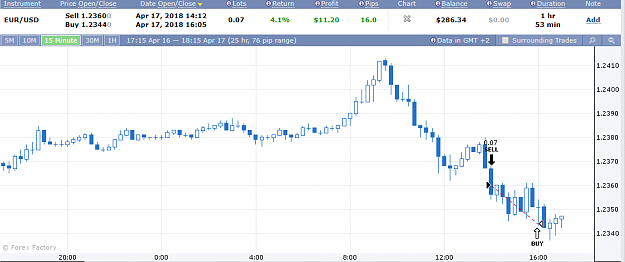
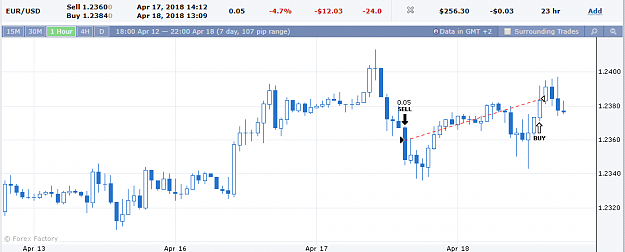
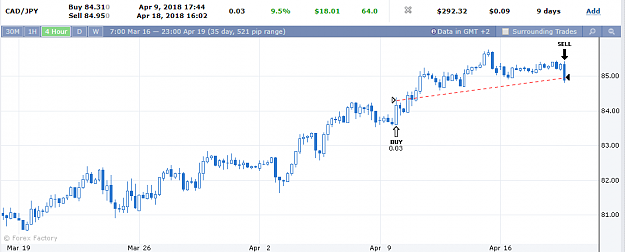
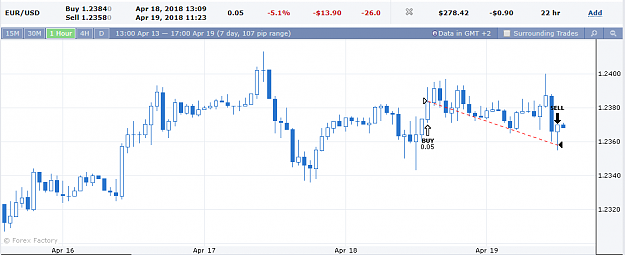
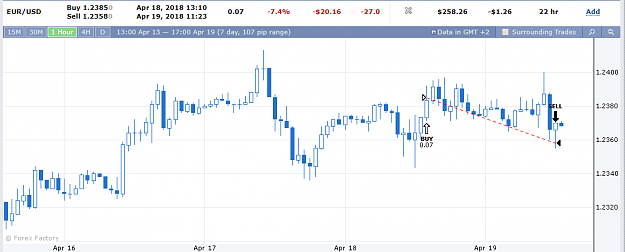
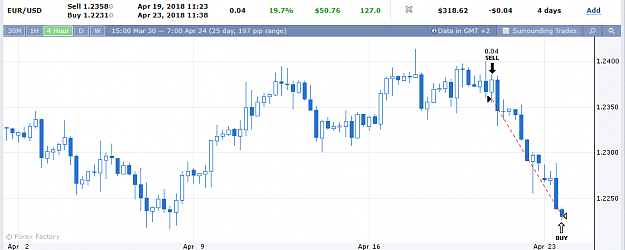
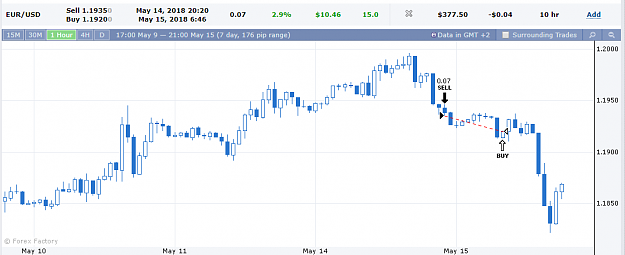
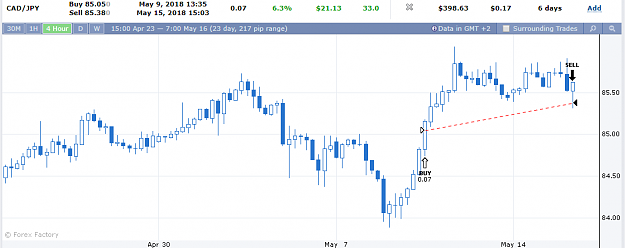
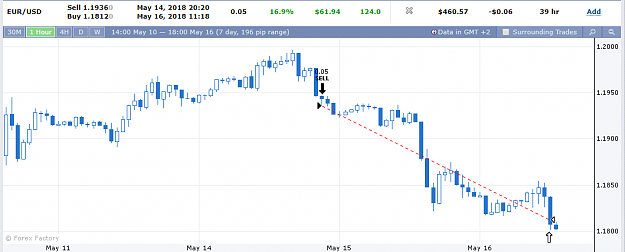
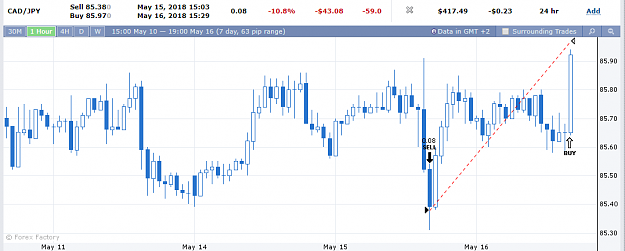
This is done by the unique analysis of current price and past prices. No fancy indicator is used here. When the price is higher that it has been for a specific period of time, there is strength and we could be in a new up trend so we want to buy. When the price is lower that it has been for a specific period of time, there is weakness so we could be in a new down trend and we want to sell. So in short, and to the contrary of a lot of dudes out there that try to buy low and sell high, I buy high to sell higher and sell low to buy lower.
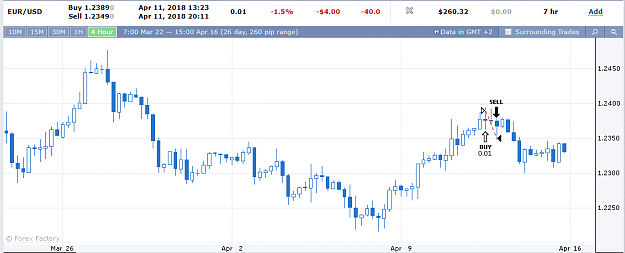
- - How to stay in the trend for a maximum of time ?
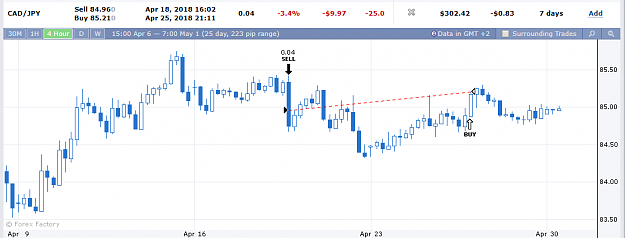
When a new trend is detected according to point 1, we enter and when the trend reverses, also as specified in point 1 we exit, and as ridiculous as this new trend could seem at the beginning, I initiate a trade in the opposite direction. It seems simple and it is, and this is the essence of this system.
-
The Style:
Technique => Price action.
Indicators => None.
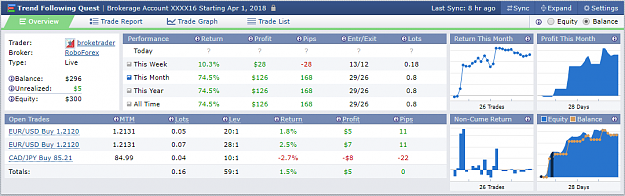
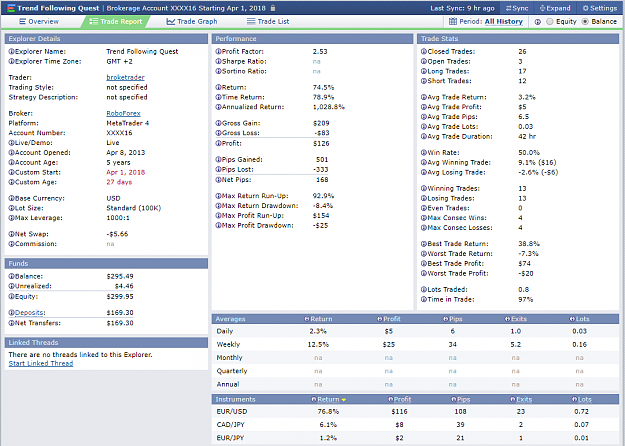
Pairs traded => EURUSD, CADJPY
Time frame => 1 hour and up.
Stop Loss => None, the rules say when to exit.
The Inspiration:
Be patient.
Respect the risk and remain humble.
Avoid being involved psychologically.
Follow the rules and not the judgments or fear, greed or hope.
Give attention to detail.
Don't expect to be right every time and when wrong, take your losses and move on.
Leave the agitation for the others, instead trade slow, be a turtle.
React to price movements and follow, price says it all, no need for a story.
Buy Strength, Sell weakness.
Rest and have good sleep.
Done talking the talk, let's walk the walk. . .
.
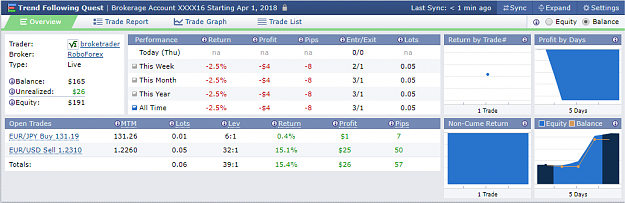
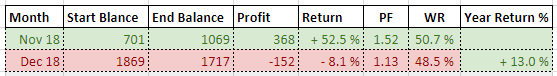
The Results:
Month....Start Balance.....End Balance... Profit.....Return....Pr Factor...Win Rate...Appreciation
April 18..........$169............$280.....+$111.....+65.7%. .......2.53......50.0%...........Luck
May 18............$280............$620.....+$340....+121.6%........ 2.53......52.5%...........Luck
June 18...........$620............$268.....-$352.... -56.7%........ 1.10......47.0%.....Rebuilding
July 18...........$418............$144.....-$274.... -65.6%........ 0.87......52.5%.....Rebuilding
--------------------------------------------------------------------------------------------------
---.......................Aug 18 - ACCOUNT BUST - STARTING AUTOMATED TRADING...................---
--------------------------------------------------------------------------------------------------
......
┌--------┬-----------┬-----------┬----------┬----------┬---------┬---------┬--------------------┐
¦........¦.....Start.¦.......End.¦..........¦..........¦..Profit.¦.....Win.¦.............. .....¦
¦..Month.¦...Balance.¦...Balance.¦...Profit.¦...Return.¦..Factor.¦....Rate.¦..Appreciation .....¦
├--------┼-----------┼-----------┼----------┼----------┼---------┼---------┼--------------------┤
¦.Aug 18.¦....$1'000.¦....$1'145.¦.....$145.¦....14.5%.¦....2.72.¦...30.8%.¦..Ok (1 week) ......¦
├--------┼-----------┼-----------┼----------┼----------┼---------┼---------┼--------------------┤
¦.Sep 18.¦....$1'391.¦....$1'545.¦.....$154.¦....11.1%.¦....1.28.¦...29.5%.¦..Bad/Consolidation.¦
├--------┼-----------┼-----------┼----------┼----------┼---------┼---------┼--------------------┤
¦.Oct 18.¦....------.¦....------.¦.....----.¦....-----.¦....----.¦...-----.¦..Account Busted !..¦
└--------┴-----------┴-----------┴----------┴----------┴---------┴---------┴--------------------┘
...
...
.
ShortCuts:.
Season 1
The Lucky Episode 1 - The Luck of the beginner
The Lucky Episode 2 - A bit more than just luck
Rebuilding Episode 3 - Starting Again
Rebuilding Episode 4 - Going Fully Automatic
Season 2
Introduction - A new Automated Era
Prologue - A good warm-up week
Episode 1 - Quite bad for a start but...
Episode 2 - Account Busted Again
Episode 3 - Good for a new Start
Episode 4 - Good Resiliency seen in a desperately flat December