Intro/purpose of post
As it says, I've got an idea to create an indicator.
The only problem is, my coding skills aren't great, so I'm wondering who would like to join me exploring this idea, and indeed develop some indicators for it?
Background
I was thinking that with much technical analysis we're taking price to create a single cycle in the chart window.
Ofcourse it can work well, but it is also limited. So how about we go in the opposite direction instead?
In other words, how about we estimate what cycles are operating, feed that data to MT4. And then ask it to predict a price according to that data.
My idea isn't revolutionary. It comes from Hurst waves. Hurst did a 1700 page course prior to the modern computer era.
Basically it explained how the wiggly lines we see can actually be explained by constructive and destructive wave interference. As an example, the classic double top pattern is simply one longer frame wave with 2 smaller regular sine waves (ie regular "up and down" waves) operating inside it.
The concept -how it would work.
1)Basics
What I propose is that the indicator allows us to choose certain waves. Ofcourse a wave can be measured as peak to peak or trough to trough. It doesn't matter as long as we are discussing a whole wave, as long as its the full "360 degrees". Its vital to remember that these are regular "up and down" sine waves. The only wave that is NOT regular, is the composite wave ie the price wave ie actual price or predicted price.
2)The fundamental of this concept.
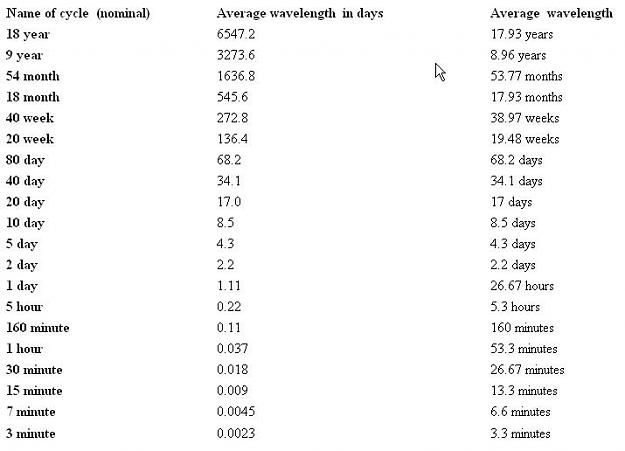
So we might choose a wave that has a length of around one day, another of around one month, another of around one week, another of around 2 hours. Now if we define the length AND amplitude of each of these waves, according to Hurst we will get a "wiggley price line" that looks like a "real life price patttern".
What we would see is the price window. Below that would be individual cycle windows ie with an indicator window for each cycle.
(Remember each cycle is a regular wave, as discussed above).
And finally, in the price window we'd see the composite wave line plotted against the price, and running some way into the future ie the predictive price.
3)Addons/advanced aspects.
Ofcourse sometimes an external factor works on the market to give a larger move. For instance US Non-Farm Payrolls.
So perhaps we would have a system of weighting of waves in place eg the afternoon of the NFP's could have its wave given a higher weighting in the computation of the composite wave.
Likewise we might see bigger moves on market opens and sometimes on market closes. Again, a factor to consider with increased weighting of certain waves.
Please note that due to the composite nature of waves in Hurst theory, ofcourse we often find smaller waves repeating to give larger waves eg 4 hourly waves give one big 4 hourly wave turn and so on. In other words, the fractal nature of the market being demonstated.
4)Putting it together.
I wouldn't intend this as a standalone system. Support and resistance, classic price action, news events could all be added. As could many other systems. BUT this approach may give us a different insight into the market than the one we are currently using.
I look forward to replies, especially from anyone keen to do some coding. Thanks.
As it says, I've got an idea to create an indicator.
The only problem is, my coding skills aren't great, so I'm wondering who would like to join me exploring this idea, and indeed develop some indicators for it?
Background
I was thinking that with much technical analysis we're taking price to create a single cycle in the chart window.
Ofcourse it can work well, but it is also limited. So how about we go in the opposite direction instead?
In other words, how about we estimate what cycles are operating, feed that data to MT4. And then ask it to predict a price according to that data.
My idea isn't revolutionary. It comes from Hurst waves. Hurst did a 1700 page course prior to the modern computer era.
Basically it explained how the wiggly lines we see can actually be explained by constructive and destructive wave interference. As an example, the classic double top pattern is simply one longer frame wave with 2 smaller regular sine waves (ie regular "up and down" waves) operating inside it.
The concept -how it would work.
1)Basics
What I propose is that the indicator allows us to choose certain waves. Ofcourse a wave can be measured as peak to peak or trough to trough. It doesn't matter as long as we are discussing a whole wave, as long as its the full "360 degrees". Its vital to remember that these are regular "up and down" sine waves. The only wave that is NOT regular, is the composite wave ie the price wave ie actual price or predicted price.
2)The fundamental of this concept.
So we might choose a wave that has a length of around one day, another of around one month, another of around one week, another of around 2 hours. Now if we define the length AND amplitude of each of these waves, according to Hurst we will get a "wiggley price line" that looks like a "real life price patttern".
What we would see is the price window. Below that would be individual cycle windows ie with an indicator window for each cycle.
(Remember each cycle is a regular wave, as discussed above).
And finally, in the price window we'd see the composite wave line plotted against the price, and running some way into the future ie the predictive price.
3)Addons/advanced aspects.
Ofcourse sometimes an external factor works on the market to give a larger move. For instance US Non-Farm Payrolls.
So perhaps we would have a system of weighting of waves in place eg the afternoon of the NFP's could have its wave given a higher weighting in the computation of the composite wave.
Likewise we might see bigger moves on market opens and sometimes on market closes. Again, a factor to consider with increased weighting of certain waves.
Please note that due to the composite nature of waves in Hurst theory, ofcourse we often find smaller waves repeating to give larger waves eg 4 hourly waves give one big 4 hourly wave turn and so on. In other words, the fractal nature of the market being demonstated.
4)Putting it together.
I wouldn't intend this as a standalone system. Support and resistance, classic price action, news events could all be added. As could many other systems. BUT this approach may give us a different insight into the market than the one we are currently using.
I look forward to replies, especially from anyone keen to do some coding. Thanks.